Application number: 184338
Page 25 of 48
Date of revision: August 18, 2011
s-a Version 2.1 dated August 26, 2011
About averages and standard deviations:
Control solution, out-of-temperature-range results, and results without a valid time or date are not
included in averages, standard deviations and trend graphs. Hi and Lo test results will be included
in averages as values of 33.3 mmol/L and 1.1 mmol/L, respectively. 14, 30 and 90 day averages
and trend graphs are calculated by taking the average of all readings within the respective time
period. Standard deviations, averages and trend graphs do not include the current day in their
calculations.
The standard deviation is an expression of the variation of readings from the average reading. The
greater this value the more variation exists between individual readings and the average. The
standard deviation feature is a way to track your glucose variability.
You can transfer your stored results to a computer to track, identify patterns and print. For
information on how to order the BGStar Diabetes Management Software please call toll free
sanofi-aventis 24 hour support Tel.: 1-888-852-6887 or visit us at
www.bgstar.ca
10.1 Viewing Individual Results
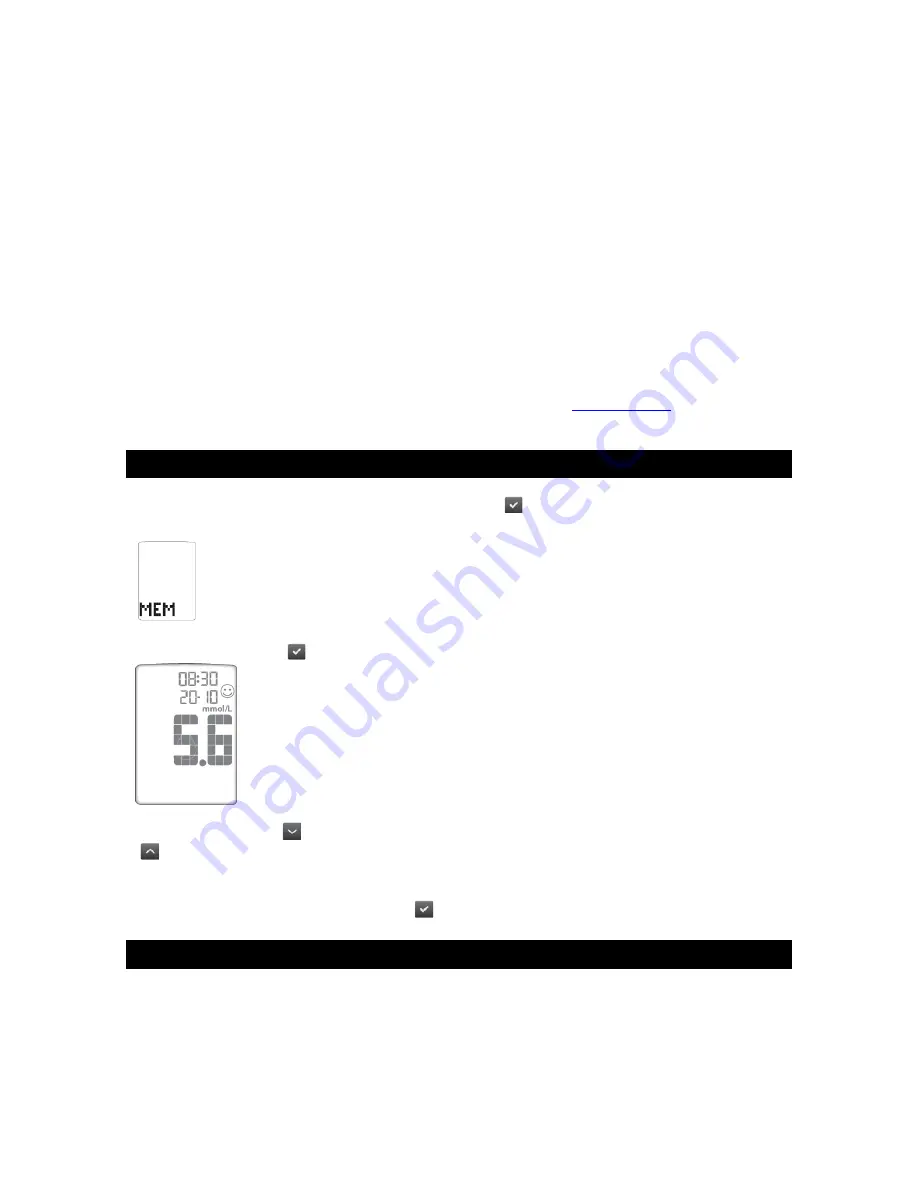
[1] When your meter is deactivated, press the CHECK (
) button once to enter menu mode. The
word “MEM” is displayed.
[2] Press the CHECK (
) button again to enter the individual results section.
[3] Press the DOWN (
) arrow button to scroll through the individual readings. Press the UP
(
) arrow button to scroll backwards.
Note: When scrolling through, the oldest test result will cycle back to the most recent test result.
To return to the menu, press the CHECK (
) button.
10.2 Viewing 14 Day Statistics
The stats feature allows you to compare your average test result, the standard deviation between
test results, and the average number of tests per day over the last 14 day period.


