SARK
SARK
SARK
SARK-
-
-
-110
110
110
110
User’s Manual
Rev 1.2.6 October 3
rd
, 2015
- 14 -
© Melchor Varela – EA4FRB 2011-2015
4.8 Changing the Vertical Axis Parameter
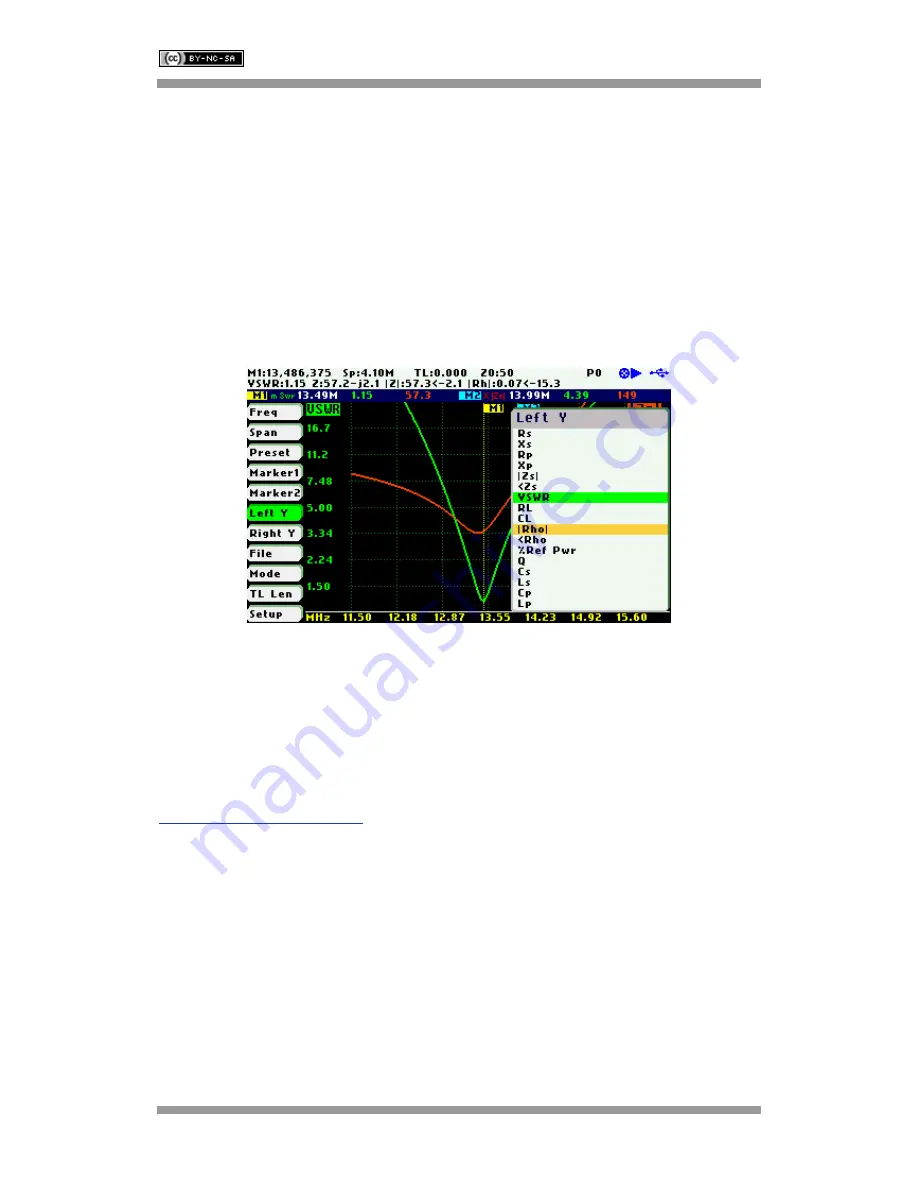
In Scalar Chart mode, the SARK-110 can display two traces from any of the available
parameters for the vertical axis. Use Navigator A to highlight either «LeftY» or «RightY» in the
main menu.
There are two methods of changing the selected vertical axis parameter:
(i) Press the Select [
■
] button to activate the LeftY or RightY popup submenu. Use Navigator B
to highlight the desired submenu parameter option. Press the Select [
■
] button to validate the
selection. Press any other button to cancel the operation.
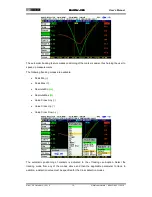
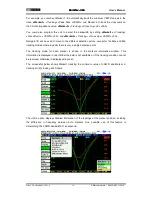
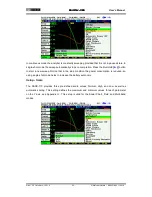
The screenshot below shows the available parameters for the vertical axis:
(ii) Use Navigator B when either the «LeftY» or «RightY» option is highlighted. Options are
selected sequentially.
4.9 Saving and Recalling Measurements
The SARK-110 has the capability to store measurements to the internal disk and recall them
either to review the data later in the analyzer screen or to download the data from the USB disk
to a PC for further analysis using SARK Plots or the ZPLOTS Excel application, available from
http://www.ac6la.com/zplots.html
.
Use Navigator A to highlight «File» in the main menu for data file operations.
Press the Select [
■
] button to activate the File popup submenu. Use Navigator B to highlight the
desired submenu File option.
«Save Data File»
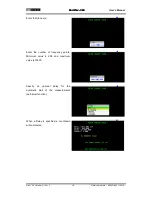
The Save Data File option enables the current measured data to be saved for further review:


