12
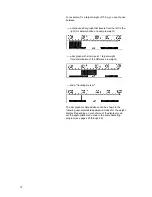
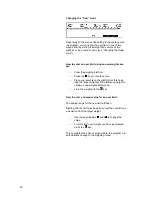
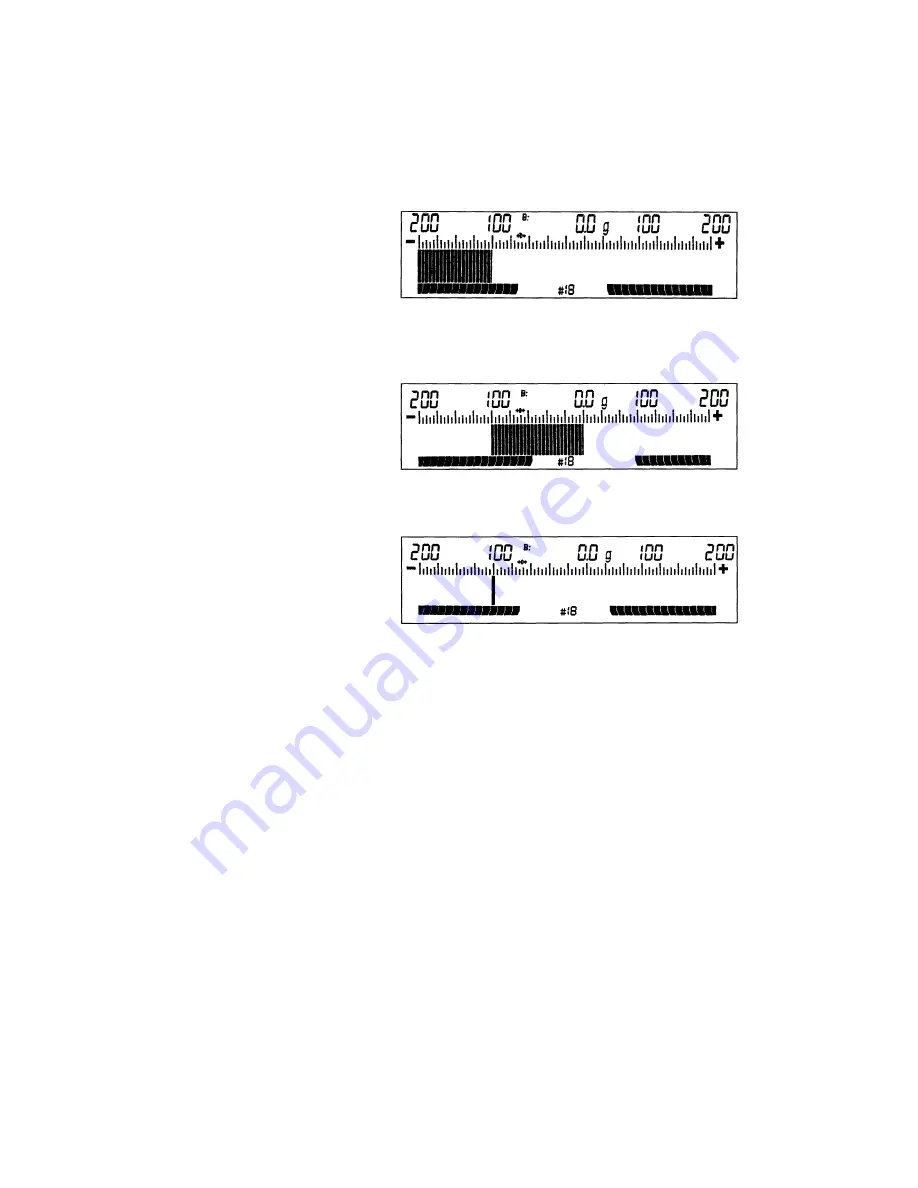
For example, for a target weight of 100 g, you can choose
between
— a continuous bar graph that travels from the left to the
right (for determination of a sample weight)
— a bar graph with a zero point = target weight
(for determination of the difference in weight)
— and a "traveling marker."
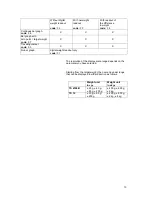
The bar graph mentioned above can be shown in the
following user-selectable application modes for the weight
display. Depending on your choice of the display mode,
set the appropriate menu code in the scale operating
program (see pages 23 through 29).
Summary of Contents for TS 12
Page 39: ......


