TB-9023
Page 14 of 16
© 2017 DESCO INDUSTRIES, INC.
Employee Owned
SCS
- 926 JR Industrial Drive, Sanford, NC 27332 • (919) 718-0000 • Website:
StaticControl.com
Reference mode is helpful if you wish to hear an audio
alarm whenever the RF exceeds a certain level.
If any of the reference modes are enabled, you should
see the REF label shown back in the main screen.
The bottom line of the display will show the reference
value of the peak signal. Note: The top line shows
the “difference” (not the PEAK as labeled) between
the ACTUAL PEAK measured and the REFERENCE
setting. Therefore, whenever the “actual peak” value of
the RF signal is higher than the reference, the difference
is a positive number and an alarm is activated. In the
example display shown, the difference is 1.453mV, the
reference is 0.700 mV, therefore the actual RF signal
peak is 2.153 mV.
Adjust the reference settings by pressing the
THRESHOLD and NAVIGATOR buttons.
When data is being recorded, the actual peak value
above the reference setting is recorded, not the
“difference” value.
Data Storage and Read (RF Signal)
The RECORD button (“R”) writes the displayed readings
and settings onto the microSD storage card; press the
“R” button to activate RECORD. At this point, the button
turns red and data is being written onto the storage
card. To stop recording, press the red button again.
Data from the microSD card can be exported using utility
software described in the data software section.
To Access the Data Using a PC
1. Visit
http://staticcontrol.descoindustries.com/
SoftwareDownloads.aspx
to download the EM Eye
File Converter software. This software will allow
you to download the data from the EM Eye Meter
and save it to your PC.
2. Install the EM Eye File Converter software.
3. Remove the microSD card from the EM Eye Meter
and insert it into your PC using an adapter (not
included).
4. Open the EM Eye File Converter software and click
File > Open.
5. Navigate to the mircoSD card location. Open the
file inside the microSD card. The extension is
“ESD3M0003.esd”.
6. Select a row of data.
7. Save it into a folder.
8. Launch Microsoft® Excel.
9. Open the file that you just saved from the folder.
10. Sort and analyze the data using the tools in Excel.
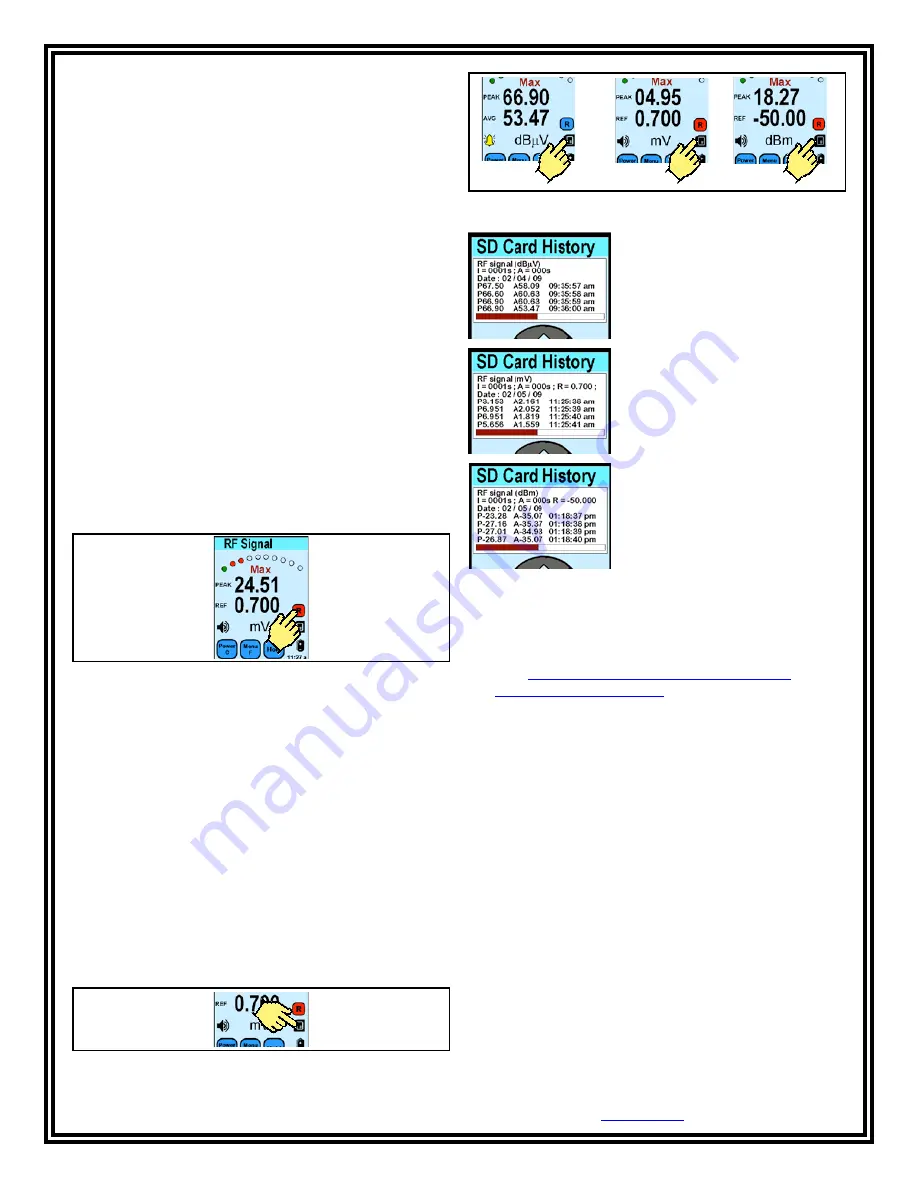
Figure 42. Locating the Data Storage button
Figure 40. Using the Record button
A data line is recorded based on the timing interval
which was preset at the “Intervals” menu.
If any of the references are enabled, a data line is
added within the preset interval whenever a peak
signal was detected above the reference setting. If
the Reference is not enabled, data lines are added at
intervals showing the current peak and average signals.
The DATA STORAGE button displays the data stored
on the microSD card found at the bottom of the meter.
Press this button to show the microSD card history
screen. Scroll through the data recorded using the
NAVIGATOR button.
NOTE: If an “X” mark is overlaid onto the DATA
STORAGE button, a non compatible SD storage card is
inserted.
Figure 41. Using the Data Storage button
RF Signal Data:
(Interval) (Average) (Date)
(Peak) (Average record) (Time)
RF Signal Data:
(Interval) (Average) (Reference)
(Date) (Peak) (Average) (Time)
RF Signal Data:
(Interval) (Average) (Reference)
(Date) (Peak) (Average record)
(Time)


