Vigilant User Manual
162/232
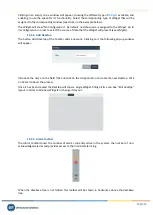
The alarm levels of the recorded data are calculated according to the settings
when the data was stored. Those levels may have changed since then, and the
interface may be showing incorrect alarm levels to those points, especially in
the Trends widget.
13.3.5.
Dynamic cursor
Those
Widgets
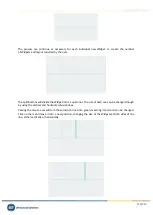
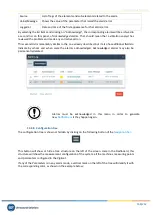
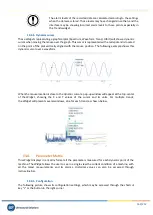
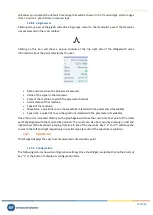
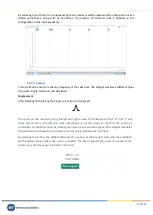
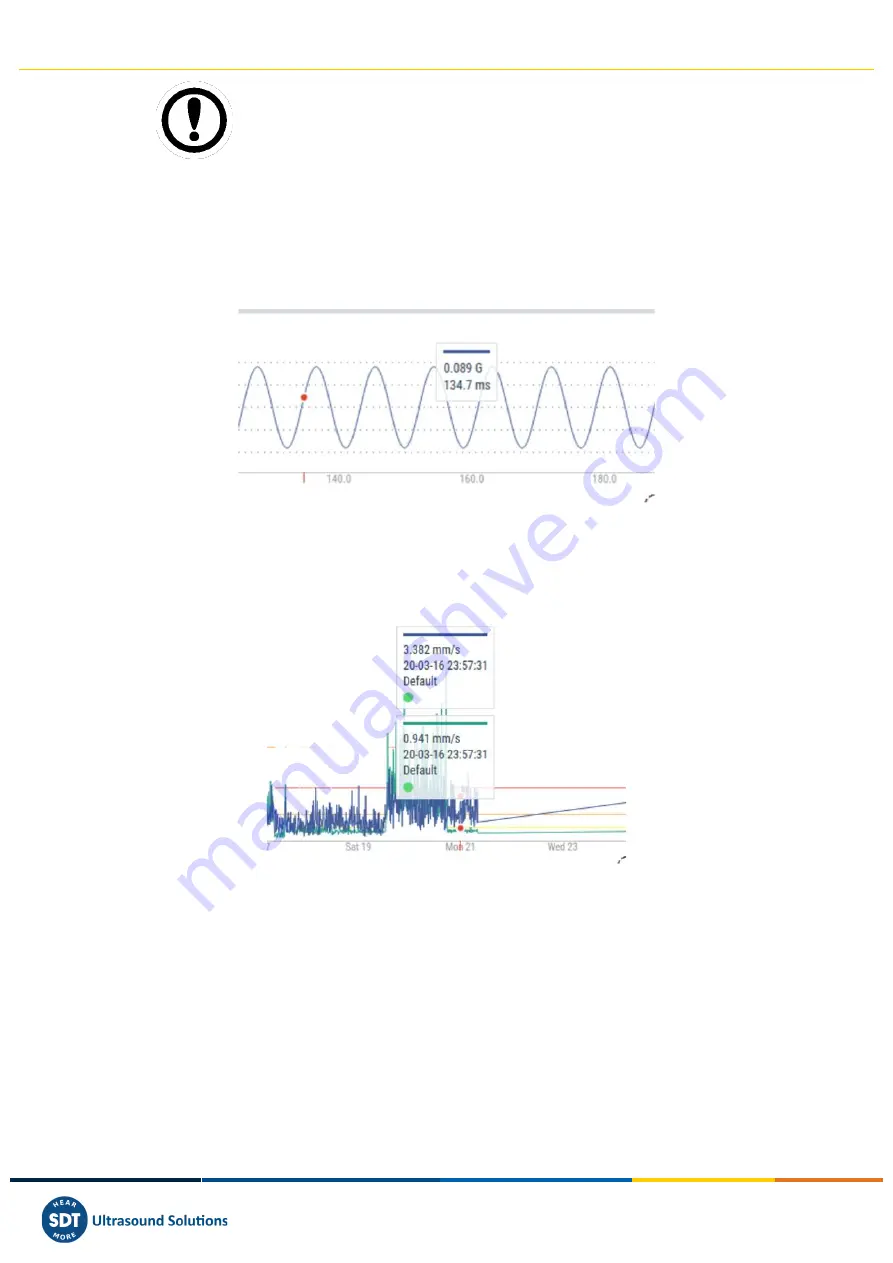
representing a graphical plot (Spectrum, Waveform, Trend, Orbit) will show a dynamic
cursor when moving the mouse over the graph. This cursor is represented with a red spot and is located
on the point of the plot vertically aligned with the mouse position. The following example shows this
dynamic cursor over a waveform.
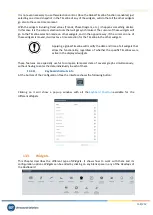
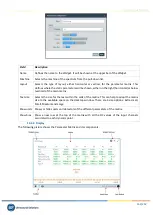
When the mouse location is close to the dynamic cursor a pop-up window will appear at the top-center
of the
Widget
, showing the X and Y values of the cursor and its units. For multiple trends,
the
Widget
will present several windows, one for each trend, as shown below.
13.4.
Parameter Matrix
This
Widget
displays in a matrix format all the parameters measured for each dynamic point of the
machine. The
Widget
allows the user to see in a single view the current condition of a machine, with
all the latest measurements and its alarms. Historical values can also be accessed through
its
timeline
bar.
13.4.1.
Configuration
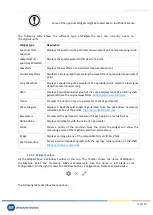
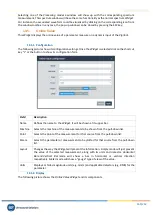
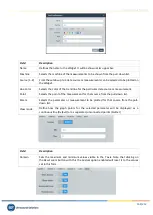
The following picture shows its configuration settings, which may be accessed through the shortcut
key “c” or the button in the right corner.


