Vigilant User Manual
168/232
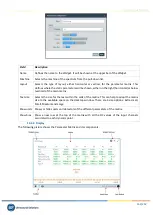
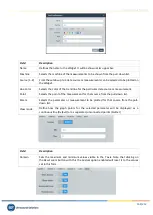
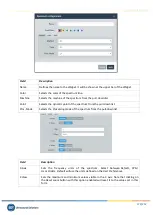
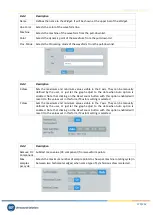
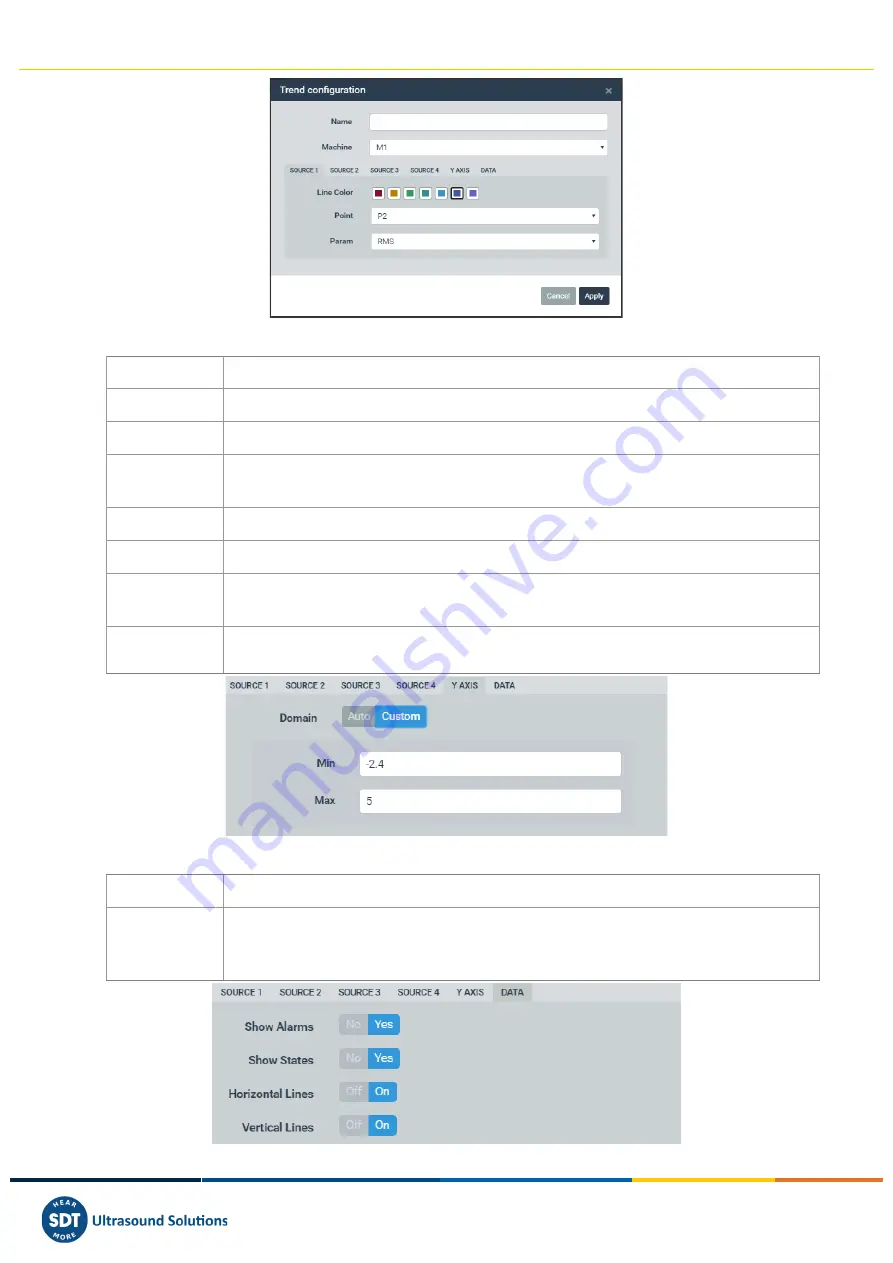
Field
Description
Name
Defines the name to the
Widget
. It will be shown at its upper bar.
Machine
Selects the machine of the measurements to be shown from the pull-down list.
Source [1..4]
From these tabs up to 4 data source or measurements can be selected to be plotted on
the
Widget
.
Line Color
Selects the color of the trend line for the particular data source or measurement.
Point
Selects the point of the measurement for that source from the pull-down list.
Param
Selects the parameter or measurement to be plotted for that source from the pull-
down list.
View mode
Define how the graph points for the selected parameter will be displayed: as a
continuous line (
Default
) or as separated, unconnected points (
Scatter
)
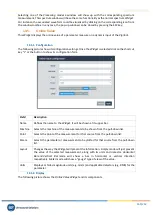
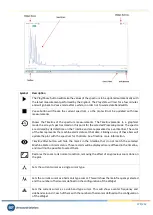
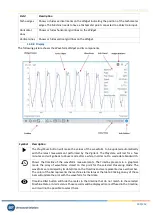
Field
Description
Domain
Sets the maximum and minimum values visible in the Y axis. Note that clicking on
the
Reset zoom
button with this the
Custom
option enabled will reset it to the values
set in this form.

