Vigilant User Manual
191/232
13.12.
Waterfall
This
Widget
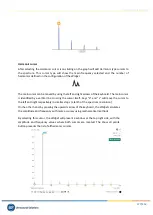
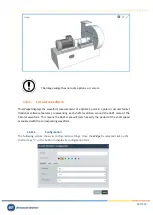
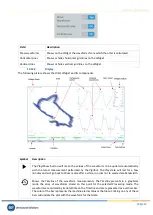
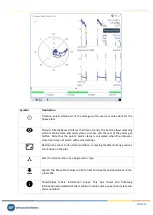
displays three-dimensional plot of a group of spectra, all of them in the same graph,
allowing to compare the different measurements and giving information about the evolution of the
signal throughout time.
A waterfall graph consists of a series of spectra acquired at consecutive times. The X-axis displays the
frequency or order of each point in the spectra. The Z-axis displays the value of the signal. The Z-axis
displays the time at which the signal was acquired.
13.12.1.
Configuration
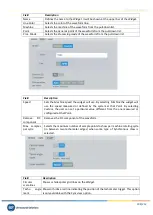
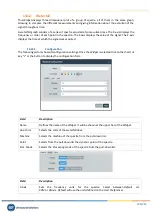
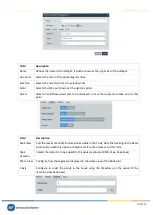
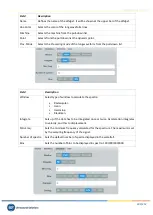
The following picture shows its configuration settings. Once the
Widget
is selected click on the shortcut
key “c” or the button to display the configuration form.
Field
Description
Name
Defines the name of the
Widget
. It will be shown at the upper bar of the
Widget
.
Line Color
Selects the color of the waterfall lines.
Machine
Selects the machine of the spectra from the pull-down list.
Point
Selects from the pull-down list the dynamic point of the spectra.
Proc. Mode
Selects the
Processing mode
of the spectra from the pull-down list.
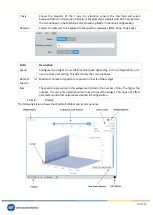
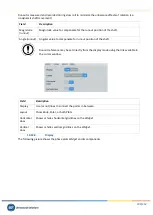
Field
Description
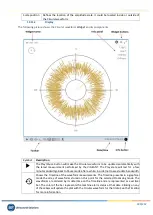
X-Axis
Sets the frequency units for the spectra. Select between
Default, Hz,
CPM
or
Orders
.
Default
will use the units defined on the
User Preferences
.

