Vigilant User Manual
196/232
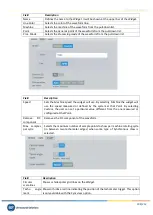
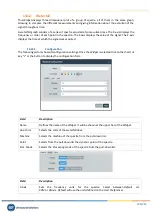
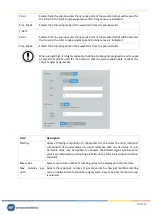
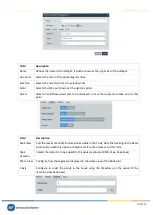
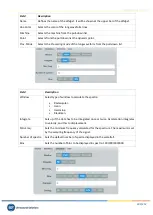
Field
Description
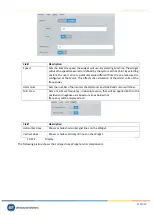
Show waveforms
Shows on the Widget the waveforms from which the orbit is calculated.
Horizontal Lines
Shows or hides horizontal grid lines on the
Widget
.
Vertical Lines
Shows or hides vertical grid lines on the
Widget
.
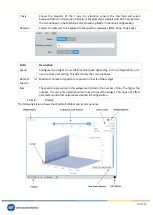
13.13.2.
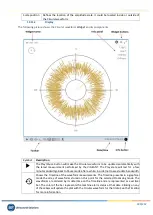
Display
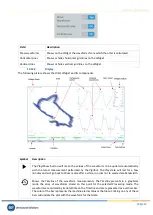
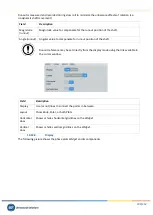
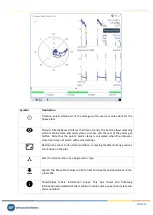
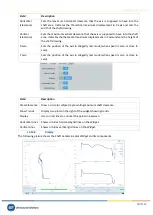
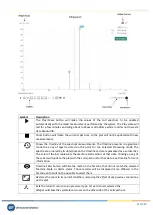
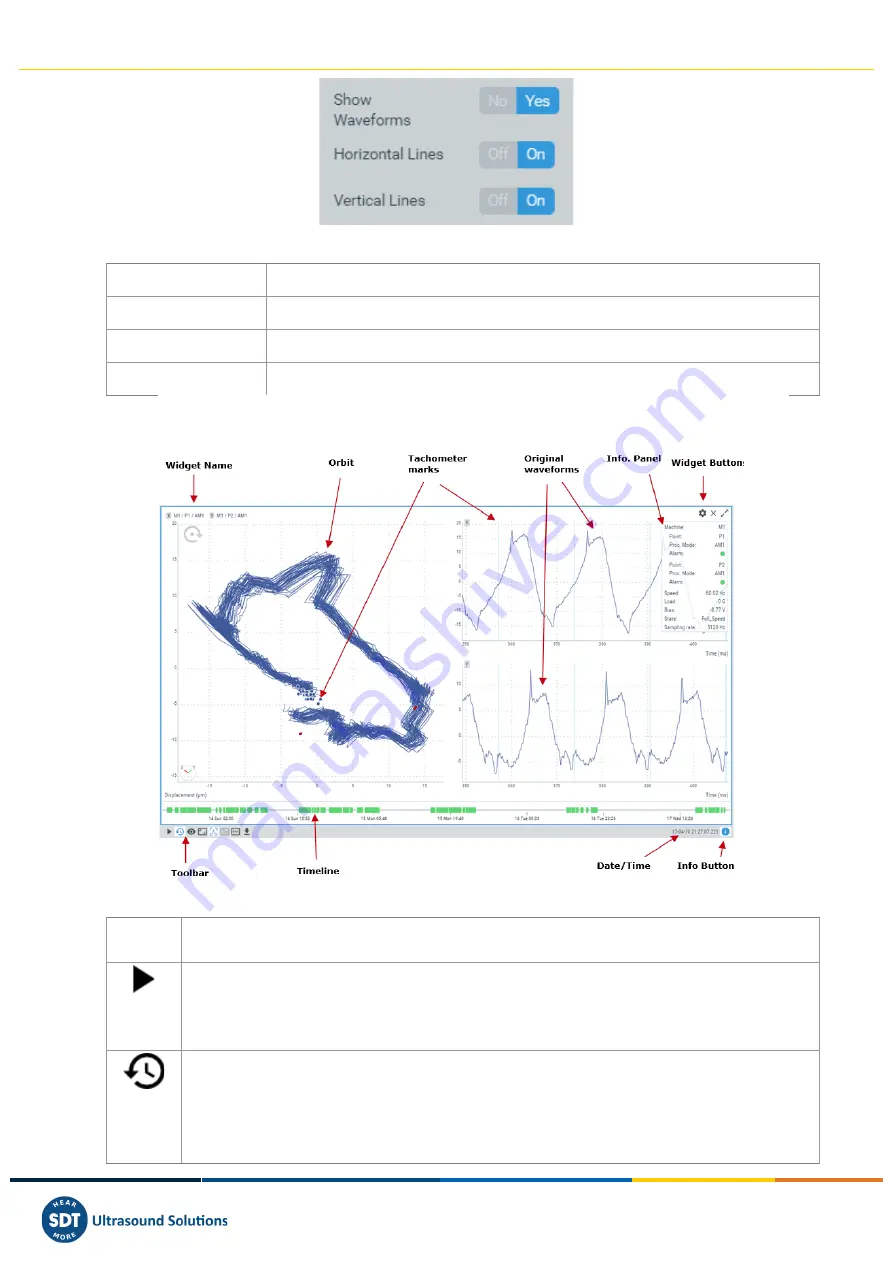
The following picture shows the Orbit
Widget
and its components.
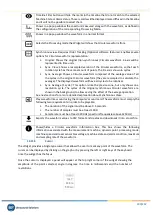
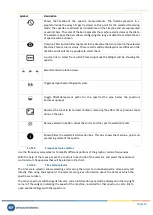
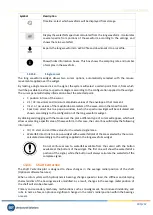
Symbol
Description
The
Play/Pause
button will make the values of the waveform to be updated automatically
with the latest measurement performed by the
Vigilant
. The
Play
state will last for a few
minutes and will go back to
Pause
mode after a while, in order not to waste data bandwidth.
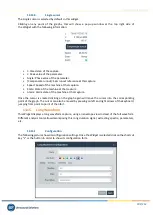
Shows the
Timeline
of the waveform measurements. The
Timeline
presents in a graphical
mode the array of waveforms stored on this point for the selected
Processing mode
. The
waveforms are ordered by its date/time on the
Timeline
and are represented as a vertical bar.
The color of the bar represents the machine alarm status at that date. Clicking on any of these
bars will update the plot with the waveform for that date.

