Vigilant User Manual
205/232
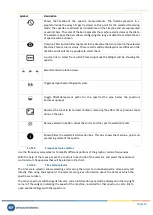
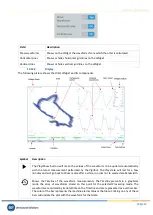
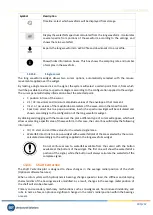
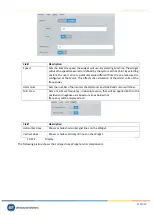
Symbol
Description
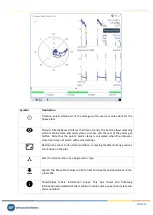
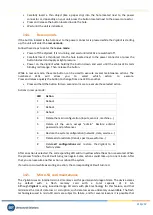
Timeline: select which waveform will be displayed from storage.
Display the waterfall's spectrum calculated from the long waveform. It calculates
several spectra from portions of the waveform, according to the settings, and
shows them in a waterfall.
Exports the long waveform to a WAV file and downloads it to a local file.
Shows/hides information boxes. This box shows the sampling rate and number
of samples in the waveform.
13.15.3.
Single cursor
The long waveform widget allows two cursor options, automatically selected with the mouse
movements applied over the widget.
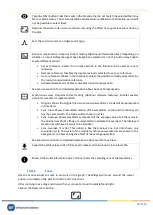
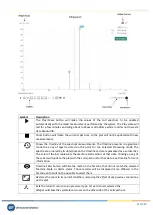
By making a single mouse click on the signal, the system will select a certain point from it, from which
it will be possible to extract a spectrum diagram according to the configuration applied to the widget.
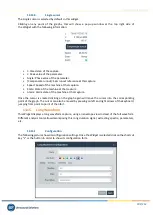
The cursor panel will display information about the selected point:
•
t: position in time of the cursor.
•
V1 / V2: maximum and minimum amplitude values of the envelope at that moment.
•
rms / p / pp: values of the magnitude parameters of the wave, also in that specific point.
•
Spectrum: direct link to a pop-up window, in which a spectrum widget will be calculated and
shown accordingly to the configuration of the long waveform widget.
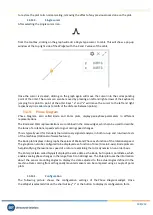
By clicking and dragging with the mouse over the plot a different type of cursor will appear, which will
allow us selecting a specific area of the waveform. In this case, the cursor box will display the following
information:
•
t0 / t1: start and end time values for the selected signal area.
•
Waterfall: direct link to a pop-up widget with a waterfall plot of the area selected by the cursor,
calculated accordingly to the settings applied in the long waveform widget.
Do not confuse access to waterfall available from the cursor with the button
available at the bottom of the widget. The first one will show the waterfall of a
portion of the signal, while the button will always calculate the waterfall of the
complete signal.
13.16.
Shaft Centerline
The
Shaft Centerline
plot is designed to show changes in the average radial position of the shaft
(Optional software features).
When a rotor system with hydrodynamic bearings changes speed or load, the stiffness and damping
characteristics of the bearings are also modified. As a result, changes in the average radial position of
the shaft will also be observed.
Primary and secondary machinery malfunctions such as misalignment, fluid-induced instability, and
rubs, to name a few, can produce significant changes in the rotor’s radial position within the bearings
or seals.

