Vigilant User Manual
213/232
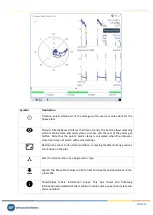
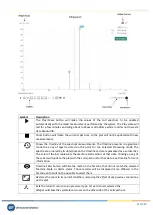
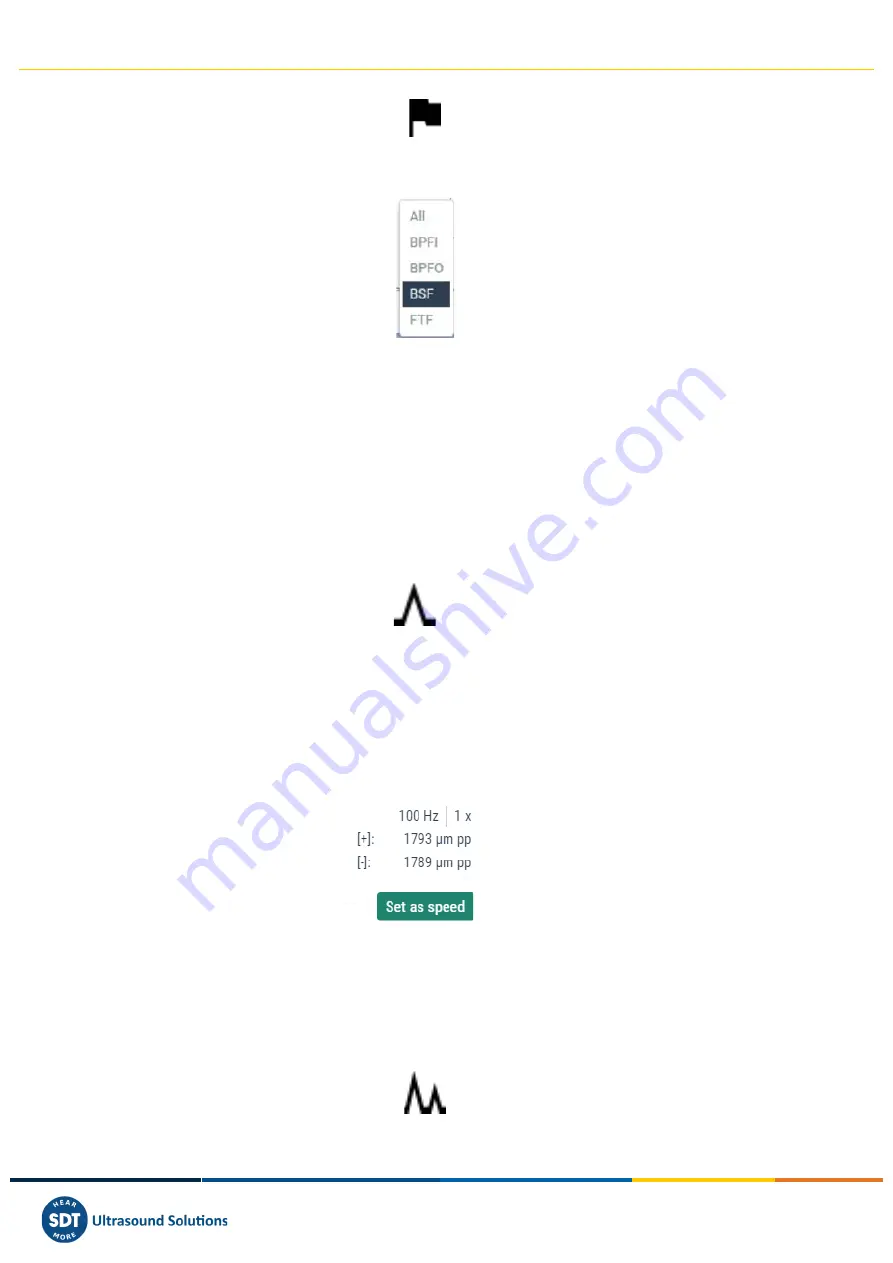
By clicking on the icon:
the Widget will show the list of
Fault Frequencies
.
By selecting one of them the corresponding
Fault Frequency
will be represented on the spectrum plot
as a dotted vertical line, along with its harmonics. The number of harmonic lines is defined on the
configuration of the
Fault Frequency
.
13.17.5.
Cursors
Cursors allow the user to mark any frequency of the spectrum. The
Widget
provides 3
different types of cursors:
Single, Harmonic
and
Side Band
.
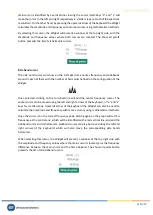
Single cursor
After selecting the
Single
cursor icon clicking on the graph will add a
Single
type of cursor
to the Full spectrum, along with the symmetrical one on the other side of the plot.
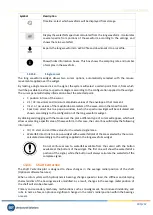
The cursor can be moved by using the left and right arrows of the keyboard. Keys “a” and “s”
will move
the cursor to the left and right respectively in smaller steps (a tenth of the spectrum resolution). On
the other hand, by pressing the upwards arrow of the keyboard the
Widget
calculates the amplitude
and frequency with more accuracy using mathematical methods.
By selecting this cursor, the
Widget
will present a window at the top right side, with the
amplitude and frequency values where both cursors are located. The
Set as speed
button
sets the speed of the Full spectrum as the frequency selected by the cursor.
Harmonic cursor
After selecting the
Harmonic
cursor icon clicking on the graph will add Harmonic type
cursors to the Full spectrum. This cursor type will show the main frequency selected and
the number of harmonics defined on the configuration of the
Widget
, along with the
symmetrical ones on the other side of the plot.
The main cursor can be moved by using the left and right arrows of the keyboard. The

