Vigilant User Manual
194/232
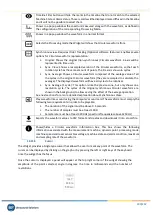
This tool will not be shown if there is not enough screen resolution available
to draw all the elements. The minimum resolution depends on the number of
spectra to be shown. Note that without a proper size this widget will not be
useful.
13.12.5.
Cursors
Cursors in the
Waterfall
are handled mainly by Keyboard Shortcuts.
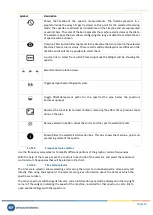
Use the
left
and
right
arrows from the keyboard to display the cursors and move through the
frequency domain selecting the points in the active spectrum.
Select the active spectrum by using the
up
and
down
arrows from the keyboard, or also using the
Time
scale selector
, explained above.
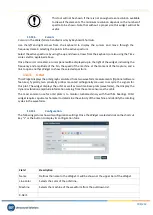
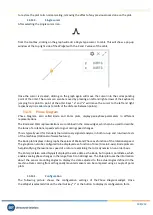
Once the cursor is created, a cursor panel will be displayed up in the right of the widget, indicating the
frequency and amplitude of the bin, the
speed
of the machine at the moment of that capture, and a
link to open another Widget to show the selected spectrum.
13.13.
Orbit
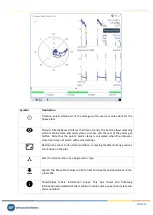
This
Widget
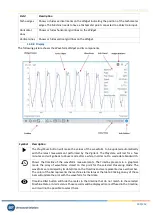
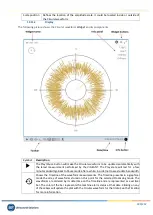
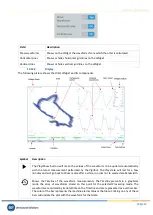
displays the orbit graph calculated from two waveform measurements (Optional software
features). Typically, two proximity probes mounted orthogonally are used to acquire the signals for
this plot. The widget displays the orbit as well as two-time base plots (waveforms), that display the
dynamic vibration amplitude information coming from the same sensors as the orbit.
The most common use for orbit plots is to monitor turbomachinery with fluid film bearings. Orbit
widget requires a pulse tachometer to determine the velocity of the machine and identify the rotating
cycles in the waveforms.
13.13.1.
Configuration
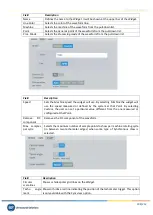
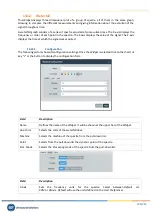
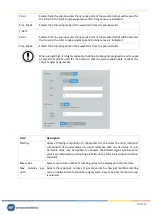
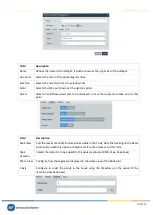
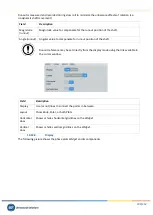
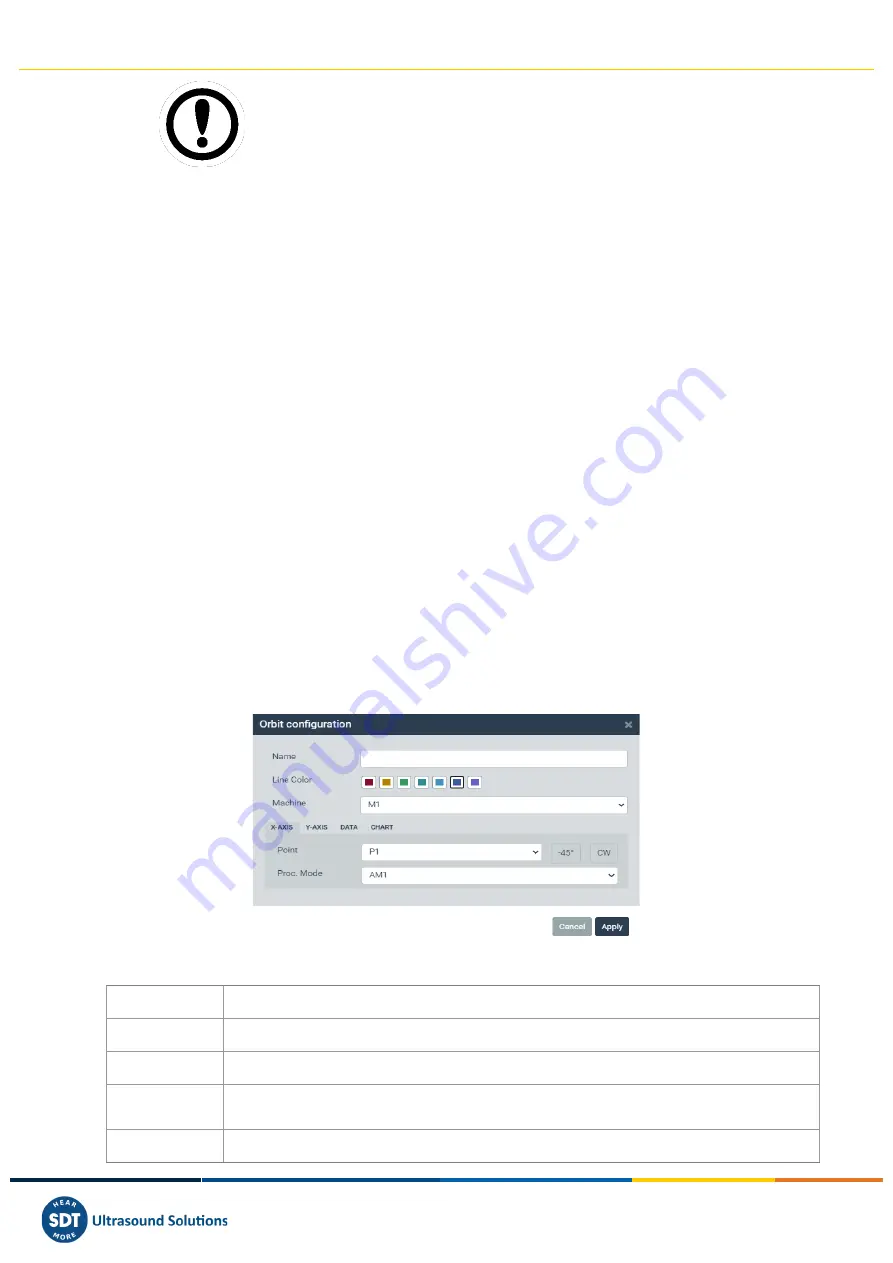
The following picture shows its configuration settings. Once the
Widget
is selected click on the shortcut
key “c” or the button t
o display its configuration form.
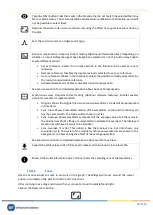
Field
Description
Name
Defines the name to the
Widget
. It will be shown at the upper bar of the
Widget
.
Line Color
Selects the color of the orbit line.
Machine
Selects the machine of the waveform from the pull-down list.
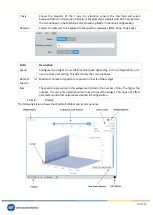
X-AXIS

