Vigilant User Manual
197/232
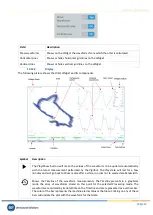
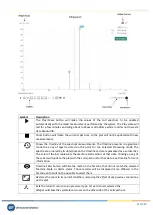
Timeline
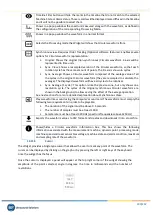
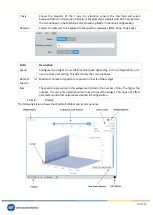
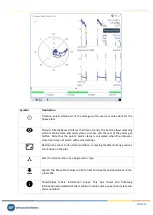
Filter
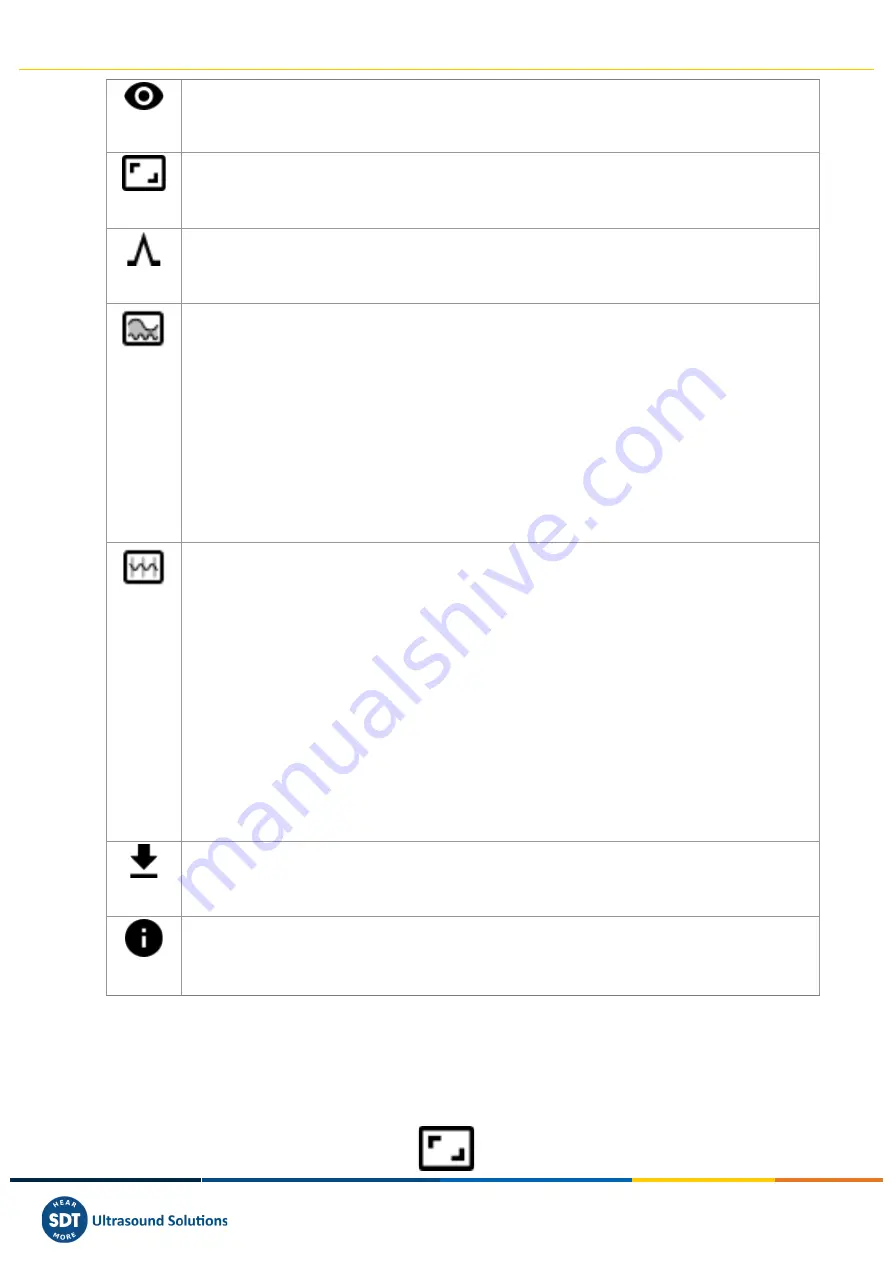
button hides the marks in the timeline that do not match the selected Machine
State or Alarm status. Those records will be displayed more diffused in the timeline, and it will
not be possible to select them.
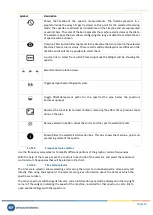
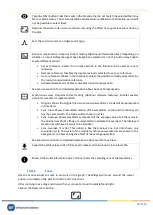
Restores the zoom to its normal condition, removing the effect of any previous zoom done on
the plot.
Sets the current cursor as a single cursor type.
Runout compensation. Requires Order Tracking (Optional software features). Depending on
whether a runout Reference signal has already been selected or not, this button may enable
several different actions:
•
Set as reference: Select the current position in the timeline to be used as runout
reference.
•
Remove reference: Disables the signal previously selected to act as a reference.
•
Go to reference: Moves in the timeline to select the position currently selected to be
the runout compensation reference.
•
Activate/Deactivate: Enables or disables runout compensation.
See previous section for a detailed explanation about Runout Compensation.
Synchronous view. Requires Order Tracking (Optional software features). Enables several
options for waveform representation:
•
Original: Shows the original (non-synchronous) waveforms. X-axis will be represented
in time units.
•
Sync. View: Shows a resampled version of the waveforms, so that each rotation cycle
has the same length. The X-axis will be shown in cycles.
•
Sync. Average: Shows waveforms composed of the average value of all the cycles in
the original waveforms (they are resampled to calculate the average). The displayed
waveforms will have all cycles to be identical.
•
Sync. Average (1 cycle): This option is like the previous one, but only shows one
revolution cycle. The cycles of the original synchronous waveforms are shown in the
background, to allow seeing the effect of the average operation.
See previous sections for a detailed explanation about Synchronous View.
Exports the orbit values to CSV format and creates and downloads it into a local file.
Shows/hides orbit information box. This box shows the sampling rate of the waveforms.
13.13.3.
Zoom
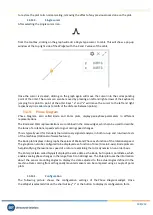
Use the mouse wheel to zoom in and out on the graph. The
Widget
will zoom around the cursor
position is located on the plot, for both X and Y directions.
After zooming-in use drag and drop with your mouse to move the plot left and right.
Click on the
Reset zoom
button:


