Vigilant User Manual
206/232
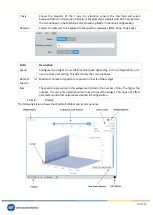
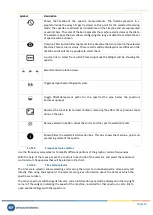
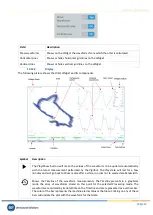
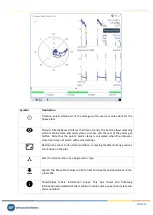
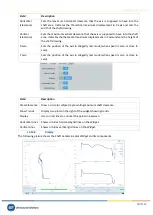
These changes in radial shaft position can be directly observed via the
Shaft CenterLine
plot.
To draw this graph, two displacement measures, normally collected by means of proximity probes, are
needed as sources. As in the case of the Orbit graph, the two points must be placed orthogonally to
reconstruct the position of the shaft in two dimensions.
13.16.1.
Configuration
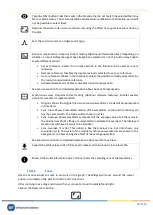
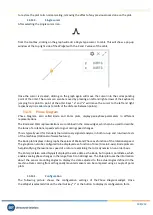
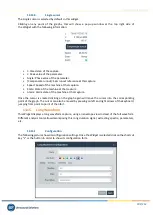
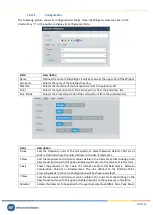
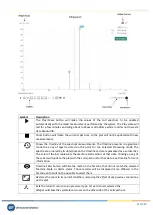
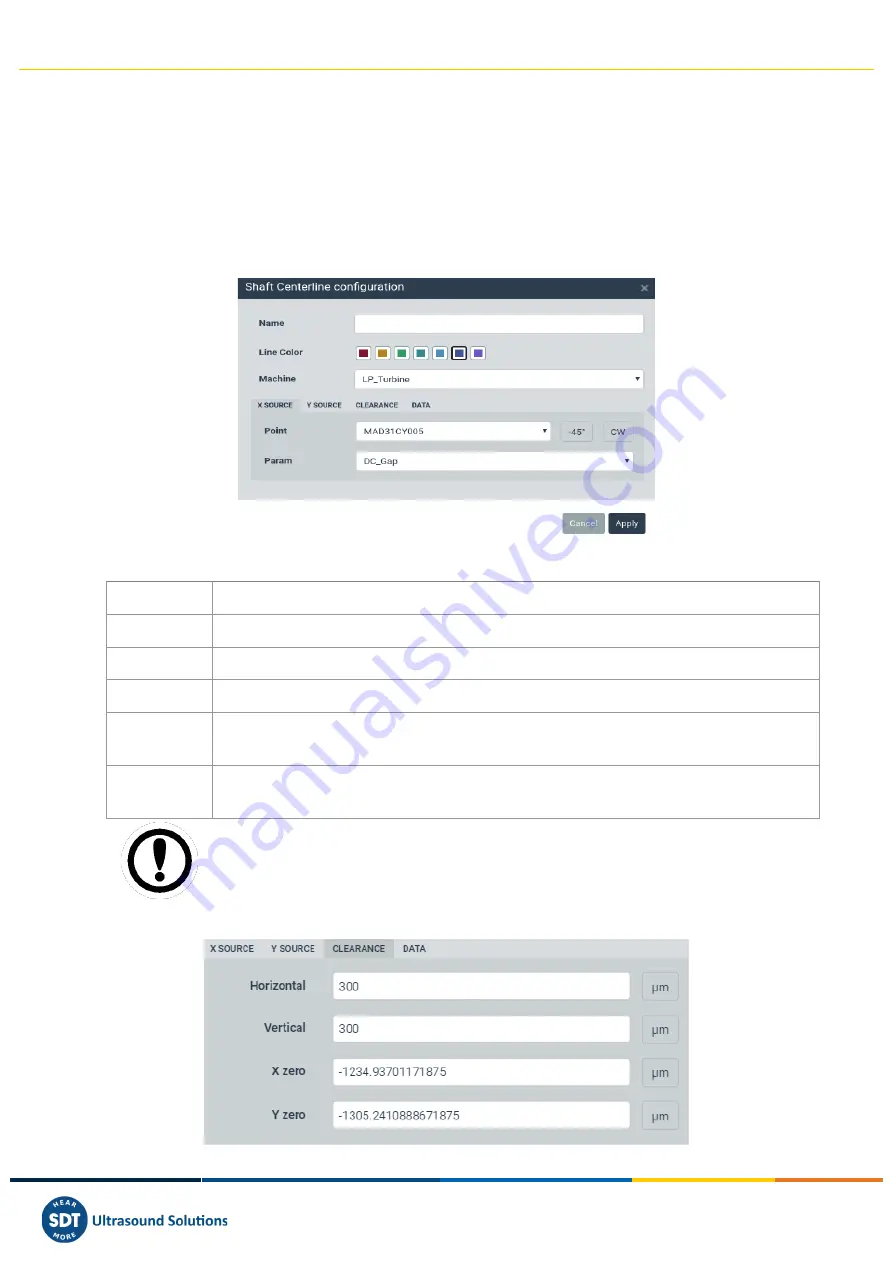
The following picture shows the configuration settings of the
Shaft Centerline
widget. Once
the
Widget
is selected click on the shortcut key “c” or the button
to display its configuration form.
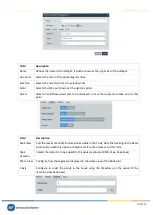
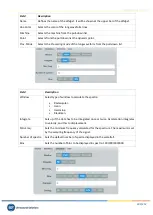
Field
Description
Name
Defines the name of the
Widget
. It will be shown at the upper bar of the
Widget
.
Line Color
Selects the color of the shaft centerline plots.
Machine
Selects the machine from the pull-down list.
Point
Selects from the pull-down list the dynamic point. Angle assignment and turning sense
are indicated.
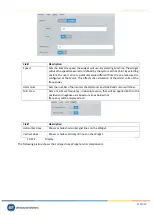
Param
Selects the parameter to be used to create the plot. Only
mean
type parameters are valid
for creating this plot.
Only
Points
with
Mean
type parameters, and using a
displacement unit
, are valid for
creating
Shaft Centerline Plots
.

