Vigilant User Manual
212/232
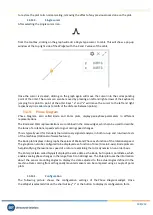
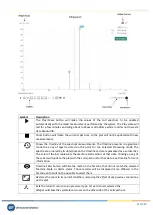
Sets the current cursor as a harmonic type cursor. This will show the main frequency
selected and the number of harmonics defined on the configuration of the Widget. For each
cursor selected the Widget will show the symmetrical cursor on the other side of the Full
spectrum.
Sets the current cursor as a side band type cursor. This will show a center frequency and
sidebands around it, each of them with the number of harmonics defined on the
configuration of the Widget.
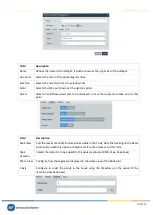
Not used with Full spectrum.
Not used with Full spectrum
Selects the Processing mode the Widget will show the Full spectrum from.
Shows the list of Fault Frequencies defined for the corresponding dynamic point. Selecting
one of them will show on the Full spectrum plot the Fault Frequency as a dotted red line,
along with the harmonics defined on its configuration.
Exports the spectrum values to CSV format and creates and downloads it into a local file.
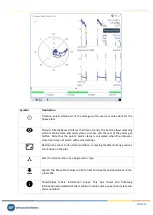
Shows/hides spectrum information box. This box shows the following information
associated with the measurement: machine, dynamic point, processing mode, machine
speed and load, sensor bias voltage, machine state and alarm condition, maximum and
minimum frequency of the spectrum.
13.17.3.
Zoom
Use the mouse wheel to zoom in and out horizontally on the Full spectrum plot. The
Widget
will
zoom the spectrum around the frequency aligned vertically with the mouse location. After
zooming-in use drag and drop with your mouse to move the plot left and right.
To make a zoom in the vertical direction, locate the mouse over the Y axis and use the mouse
wheel. The spectrum plot will vertically zoom in and out.
Since firmware version 1.0.X it is also possible to use the rectangular zoom, to amplify a specific
section of the graph, using the
SHIFT
key and the click and drag gesture of the mouse. The SHIFT
key can also be combined with the keys
CTRL
and
ALT
to specify a vertical or horizontal zoom on
a section of the graph.
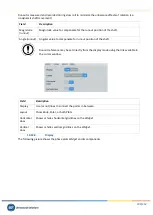
Click on the
Reset zoom
button to restore the plot to its normal scaling, removing the effect of
any previous zoom done on the plot
.
13.17.4.
Fault Frequencies
This option shows on the Full spectrum plot the fault frequencies assigned to the measurement
point. Fault frequencies are those related to different failure modes on the machine (gear mesh,
ball bearing, RPM harmonics, belts, etc.). These frequencies are defined on the configuration of
the system and can be assigned to the different dynamic points.

