Pinpointing
109
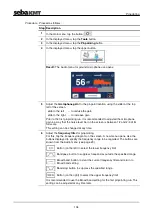
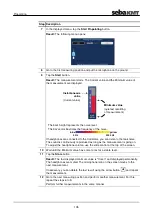
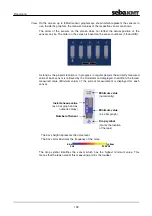
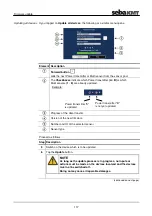
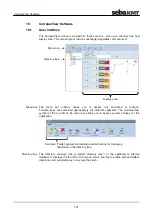
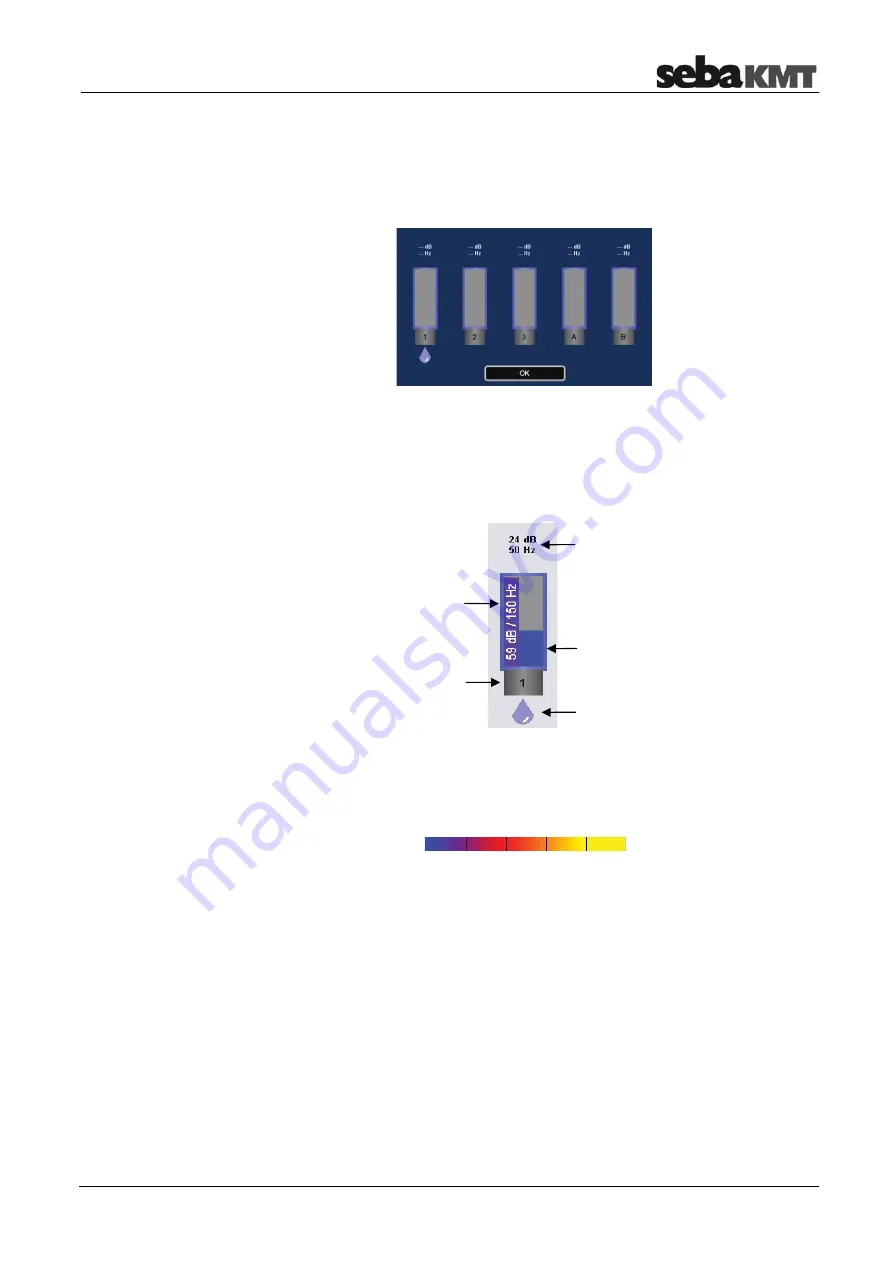
On the screen, up to 8 Multi sensor graphics are shown which represent the sensors in
use. Inside the graphics, the measured values of the respective sensor are shown.
The order of the sensors on the screen does not reflect the actual position of the
sensors on site. The order on the screen is based on the sensor numbers (1-8 and A/B).
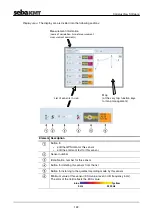
As long as the pinpoint location is in progress, in regular periods the currently measured
value of each sensor is retrieved by the Correlator and displayed. In addition, the lowest
measured value (Minimum value) of the current measurement is displayed for each
sensor.
The bar's height represents the noise level.
The bar's color illustrates the frequency of the noise.
blue
yellow
0 Hz 3300 Hz
The drop symbol identifies the sensor which has the highest minimum value. This
means that the leak noise at this measuring point is the loudest.
View
Minimum value
(numerically)
Instantaneous value
(as a bar graph and as
numeric values)
Minimum value
(as a bar graph)
Number of Sensor
Drop symbol
(marks the location
of the leak)
Summary of Contents for Correlux C-3
Page 2: ...Consultation with SebaKMT 2 ...
Page 8: ...Terms of Warranty 8 ...
Page 14: ...Frequently used menus 14 ...
Page 18: ...Frequently used menus 18 ...
Page 20: ...Frequently used menus 20 ...
Page 22: ...Frequently used menus 22 ...
Page 24: ...Frequently used menus 24 ...
Page 26: ...Frequently used menus 26 ...
Page 40: ...The Multi sensors 40 ...
Page 60: ...Sensor management 60 ...
Page 68: ...Online correlation 68 ...
Page 76: ...Offline correlation Multipoint measurement 76 ...
Page 84: ...Real time measurement 84 ...
Page 92: ...Sound velocity measurement 92 ...
Page 100: ...Storage Management of correlations History 100 ...
Page 102: ...Reset of correlation settings and data 102 ...
Page 110: ...Pinpointing 110 ...
Page 120: ...Firmware update 120 ...

