Frequently used menus
15
2.3 Correlation
menu
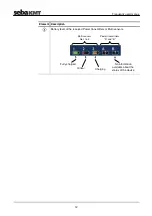
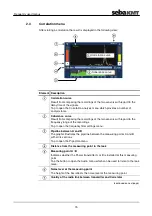
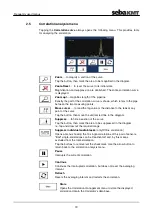
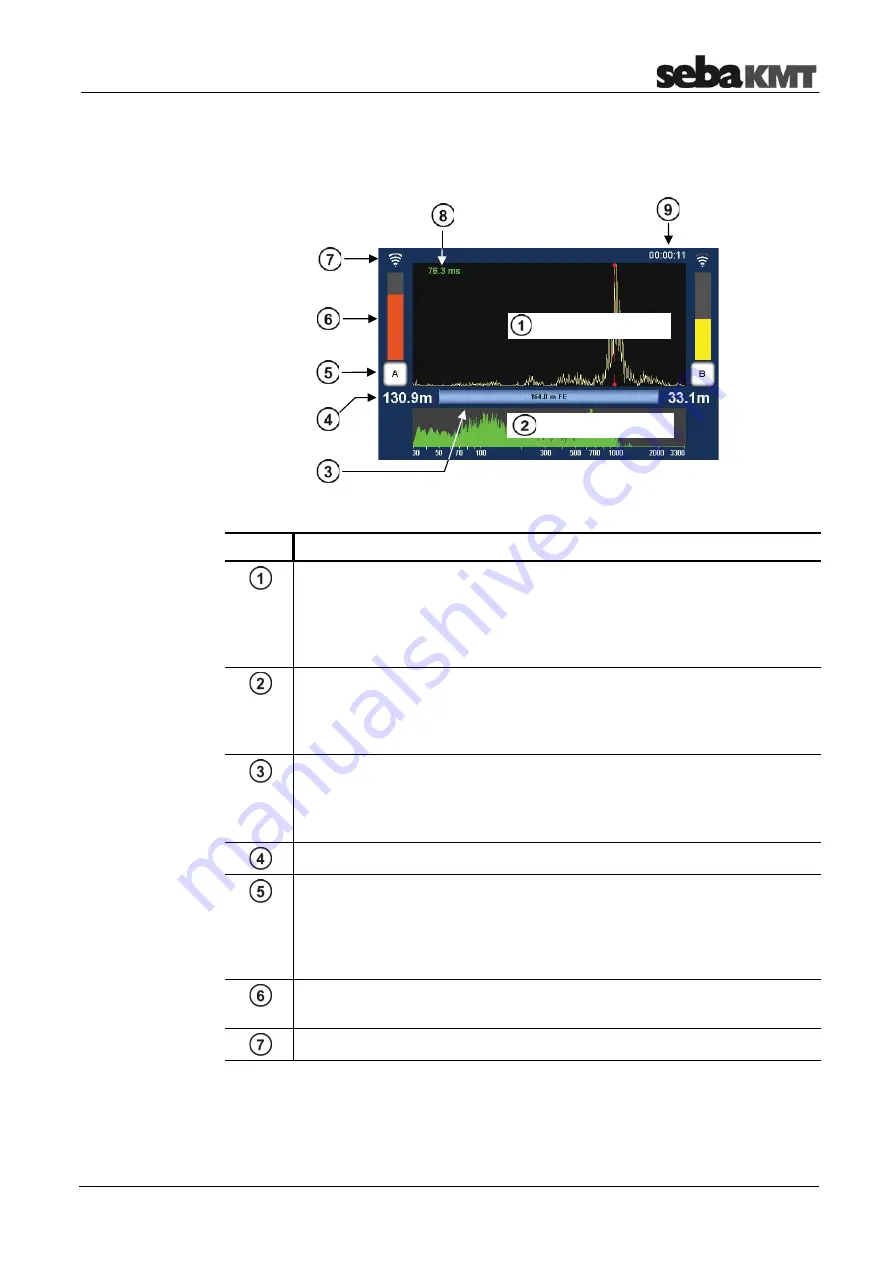
After starting a correlation the result is displayed in the following view:
Element Description
Correlation curve
Result from comparing the recordings of the two sensors with regard to the
delay time of the signals.
Tap to open the Correlation analysis menu which provides a number of
analysis tools.
Coherence curve
Result from comparing the recordings of the two sensors with regard to the
frequency range of the recordings.
Tap to open the frequency filter settings menu.
Pipeline between A and B
The graphic illustrates the pipeline between the measuring points A and B
with all its sections.
Tap to open the Pipe data menu.
Distance from the measuring point to the leak
Measuring point A / B
Indicates whether the Power transmitter A or B is installed at this measuring
point.
Tap the button to open the Audio menu which can be used to listen to the leak
noise.
Noise level at the measuring point
The height of the bar reflects the noise level at the measuring point.
Quality of the radio link between transmitter and Correlator
(continued on next page)
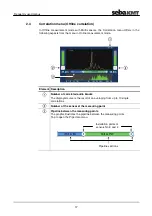
Correlation curve
Coherence curve
Summary of Contents for Correlux C-3
Page 2: ...Consultation with SebaKMT 2 ...
Page 8: ...Terms of Warranty 8 ...
Page 14: ...Frequently used menus 14 ...
Page 18: ...Frequently used menus 18 ...
Page 20: ...Frequently used menus 20 ...
Page 22: ...Frequently used menus 22 ...
Page 24: ...Frequently used menus 24 ...
Page 26: ...Frequently used menus 26 ...
Page 40: ...The Multi sensors 40 ...
Page 60: ...Sensor management 60 ...
Page 68: ...Online correlation 68 ...
Page 76: ...Offline correlation Multipoint measurement 76 ...
Page 84: ...Real time measurement 84 ...
Page 92: ...Sound velocity measurement 92 ...
Page 100: ...Storage Management of correlations History 100 ...
Page 102: ...Reset of correlation settings and data 102 ...
Page 110: ...Pinpointing 110 ...
Page 120: ...Firmware update 120 ...


