Additional measuring functions
62
7.2.3
Displaying the frequency spectrum of the leak noise (in Professional
mode only)
In Professional mode, you can view the frequency spectrum of the saved leak noise for
an even more in-depth analysis.
Sometimes the assumed leak noise stems from a known source of interference (e.g.
50 Hz/100 Hz mains voltage or a pump in operation). However, you should not
prematurely believe the conspicuous noise to be non-critical because there could still be
a real leak noise next to the background noise. By analysing the frequency spectrum,
you can check the saved noise for frequency peaks other than those of the interference.
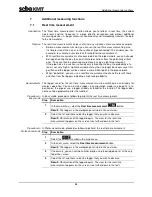
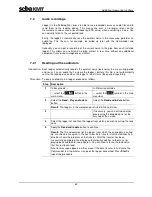
Apply the
Spectrum
button in the menu for playing back audio files (see previous page).
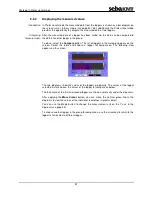
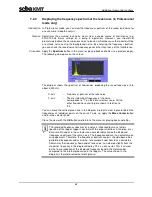
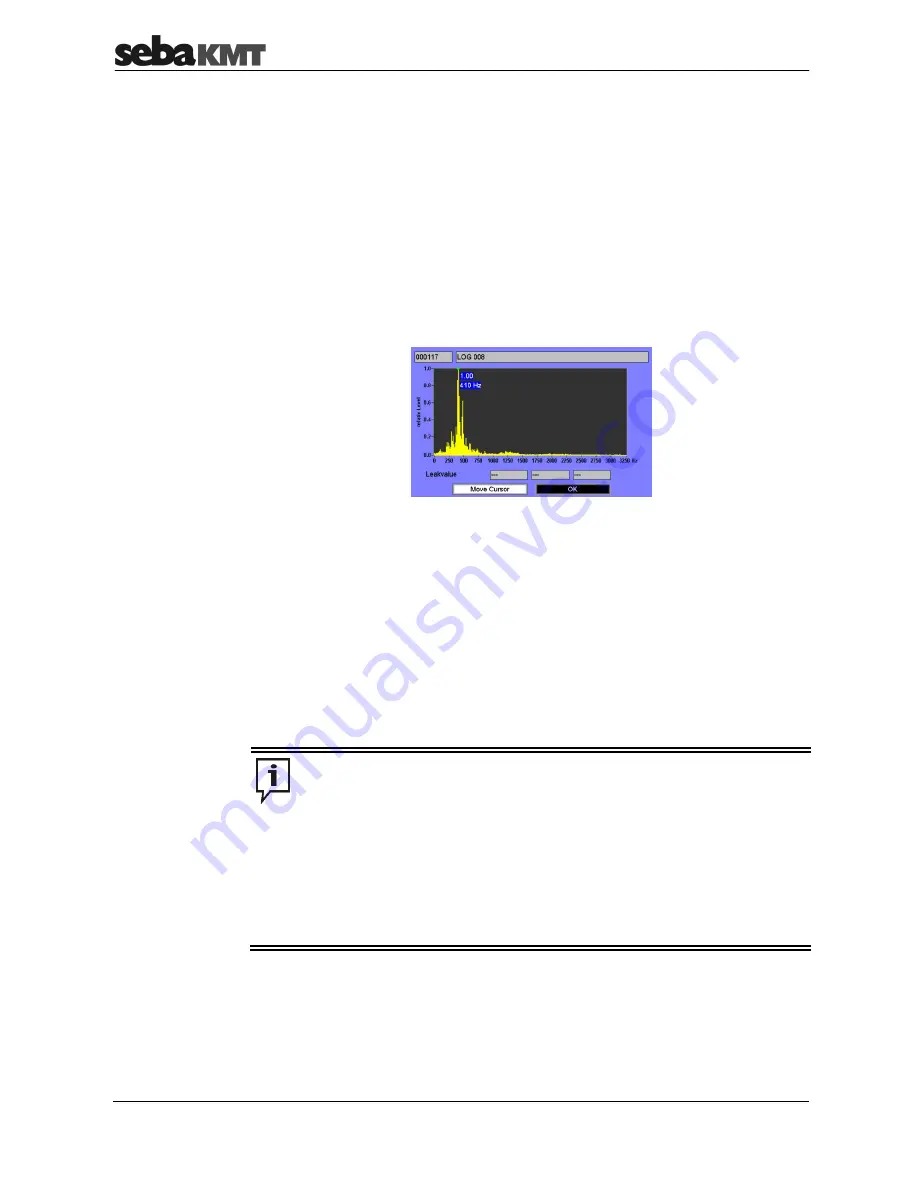
The following view opens on the screen:
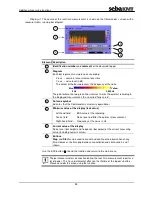
The diagram shows the spectrum of frequencies producing the saved leak noise (0 to
about 3,250 Hz).
X-axis
… Frequency spectrum of the leak noise
Y-axis
… The most dominant frequency of the noise
corresponds to “1” on the dimensionless scale. All the
other frequencies occurring are shown in relation to
this.
You can move the vertical green line in the diagram in order to view in greater detail the
frequencies at individual points on the curve. To do so, apply the
Move Cursor
button
and turn the selector knob.
Close the view with the
OK
button and return to the menu for playing back audio files.
The recorded frequency spectrum of a noise is influenced by many factors
(position of the logger, logger’s contact with the pipe, reflections in the pipe, etc.).
Even small changes in these factors can considerably change the displayed
frequency spectrum of the same noise. The inexperienced user can quickly make
misjudgements. Therefore, the frequency spectrum analysis should above all be
performed by experienced users who, for example, know how to use correlators.
Sometimes the frequency shown under “leak value” can diverge slightly from the
maximum frequency in the diagram display. This is not an error. This is caused
by the finer graduation of the displayed frequency band in the Commander,
compared to the internal graduation in the loggers. The value shown in the
diagram is therefore somewhat more precise.
Introduction
Purpose
Procedure


