50
RESULT INTERPRETATION
Explanation and criteria of the printed results.
1. Personal Data
The subject's ID / name, date, height, weight, age and gender are indicated on the result sheet.
2. Company Logo
The measurer can input a customized LOGO such as the name of a hospital, sports center, or
obesity clinic, telephone number, address, contact person, etc.
Refer to the software manual for logo insertion.
3. Body Composition Analysis
The
body composition analysis is indicated in the ratio based on the subject’s weight.
①
Weight: the sum of total body water, minerals, protein, and body fat in the table.
②
M.B.F. (Mass of Body Fat): calculated by subtracting lean body mass from weight.
③
L.B.M. (Lean Body Mass): calculated by subtracting mass of body fat from body weight. Lean
body mass consists of fat free masses such as muscle, organs, blood and water.
④
S.L.M.: (Soft Lean Mass): composed of body water and protein.
⑤
Minerals: composed of bone and electrolytes.
⑥
Protein: a major element composed of soft lean mass together with body water.
⑦
T.B.W. (Total Body Water): consists of intra-cellular and extra-cellular water. For healthy adults,
body water is 45 ~ 65% of body weight, though it varies between persons.
Assessment of Under, Optimal, and Over in the table is assessed by the optimal range based
on standard weight of the subject.
4. Obesity Assessment
This assessment helps the subject to control body composition and weight. The body
composition analysis result is compared with the ideal body composition for the age and gender
of the subject. The result is displayed in a bar graph. Optimal range of weight and soft lean
mass is calculated on the basis of standard weight.
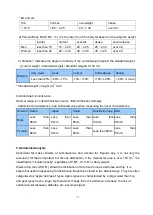
1) Body Mass In
dex (B.M.I., Quetlet’s Index: kg/m
2
): for adults
*EAST ASIA
thin
normal
overweight
obese
< 18.5
18.5 ~ ≤ 23
23 ~ ≤ 25
over 25
Summary of Contents for Accuniq BC380
Page 1: ......

