Oryx DTS User Manual v4
Page 71
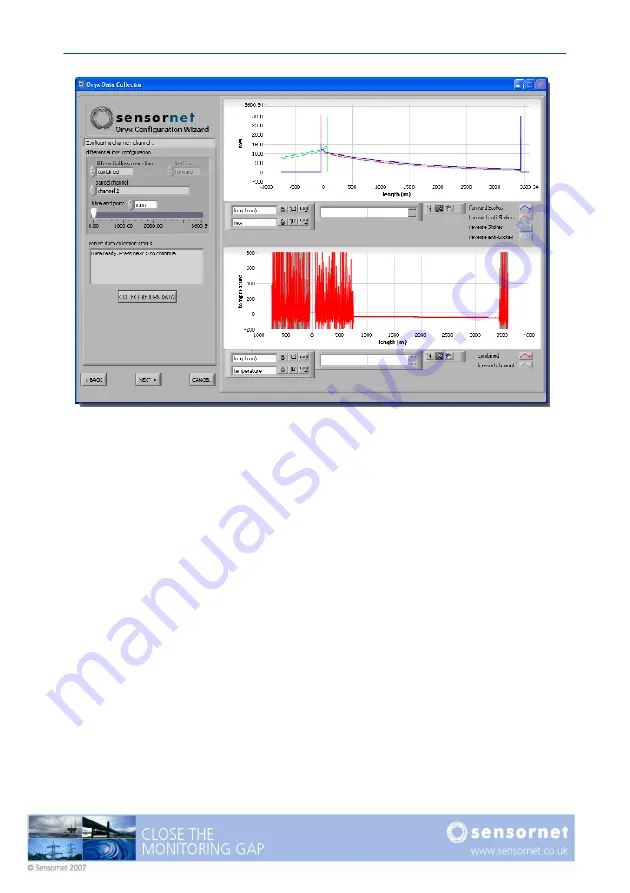
Figure 50 - Forward and reverse data collected
Setting the Fibre End Point
The end point of the fibre now needs to be defined in order to correctly align the
forward and reverse signals. Using the graphical zoom functions, expand the scale
on the upper, raw data, display and the lower temperature display to clearly see the
region around the end of the fibre. A useful guide would be to have the length scale
show about 150m to 200m at the end of the traces. See Figure 51.
Since the very last ~50m of fibre is the internal reference section of the Oryx DTS,
the actual fibre cable end position is approximately 50m less than the point at which
the raw data signals drop to zero. This point is the connector at the output of the
DTS and can typically been seen on the raw data traces as a small drop in signal
(due to the connector loss) or, a small spike due to a reflection. An example of this
is clear in Figure 51, upper plot. The lower temperature plot may also show an
anomaly at the same connector position. The position of this connector should be
used as the setting for the ‘fibre end point’ and can be entered (typed) directly into
the numerical field.
In Figure 51, the end point has been set at 3392m.
Summary of Contents for ORYX DTS
Page 1: ...This page intentionally blank ...
Page 2: ......
Page 5: ......
Page 6: ...This page intentionally blank ...
Page 70: ...Page 64 Oryx DTS User Manual v4 Figure 45 Setting a zone Figure 46 The list of defined zones ...
Page 100: ...Page 94 Oryx DTS User Manual v4 This page intentionally blank ...
Page 101: ......


