FiberPatrol FP1150 Product Guide
Page 123
•
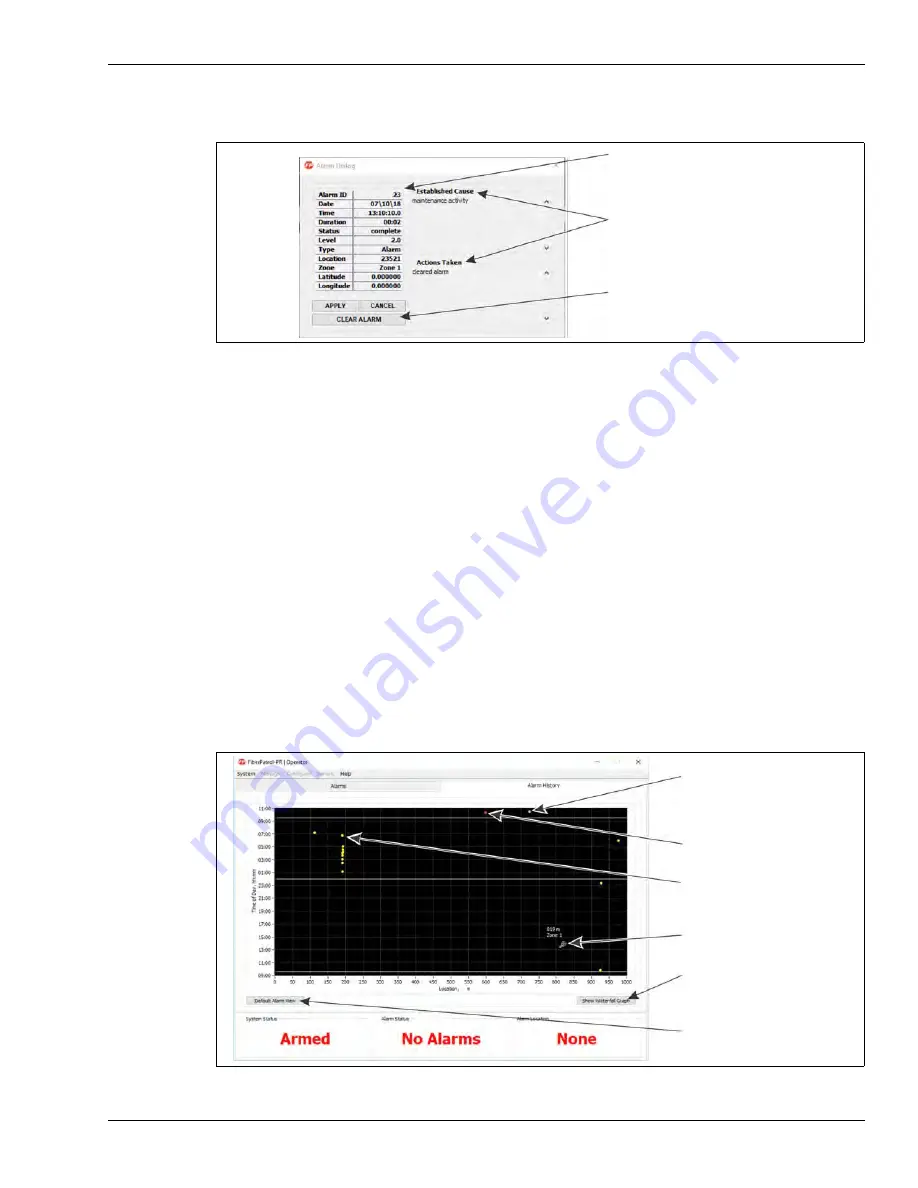
The Cancel button discards the Operator’s comments and closes the Alarm Dialog without
clearing the alarm.
Once the alarm is cleared, the Alarm Dialog closes and the selected alarm is removed from the
Current Alarms list and Map Display. The details of the cleared alarm are accessible through the
Alarm Log on the Log sub-panel for the remainder of the day (until archived). The details of the
cleared alarm remain accessible through the archived log files.
The Alarm Dialog window has a display time limit of five minutes. If the Alarm Dialog closes
because the time limit is exceeded, any text entries will be retained but the alarm will not be
cleared.
Alarm History Sub-Panel
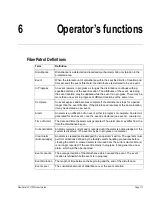
The Alarm History sub-panel provides an overview of the alarms that were generated over the
24-hour period beginning last midnight (24-hour limit). All events are shown regardless of whether
the corresponding alarms have been cleared. The events in progress are shown as red dots, the
completed events are shown as yellow dots and current disturbances (not yet events) are shown
as gray dots. The horizontal axis of the display graph is the location and the vertical axis is the
time. The Alarm History sub-panel is provided for information purposes, there are no actions
associated with this sub-panel. The Show Waterfall Graph button displays the disturbance signals
in a different format.
Figure 139 FiberPatrol Alarm Dialog
Figure 140 Alarm History Sub-Panel
selected alarm details
Clear Alarm button
text entry fields for the Alarm Cause and
Actions Taken
the Show Waterfall Graph
completed Events are
current disturbances
are displayed in gray
(not yet Events)
Events in progress are
displayed in red
displayed in yellow
button displays the alarm
information in another format
the Default Alarm view returns
the graph to its original display
right-click to display location
left-click and drag to zoom-in
format


