28
Operations
-48 VDC Remote Power Manager
Installation and Operations Manual
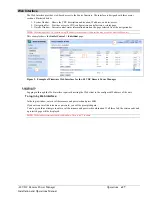
System Summary
The
System > Summary
page is typically displayed as the default page at user login to the firmware Web interface.
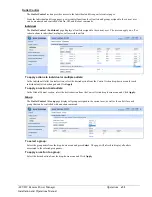
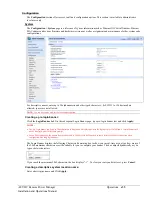
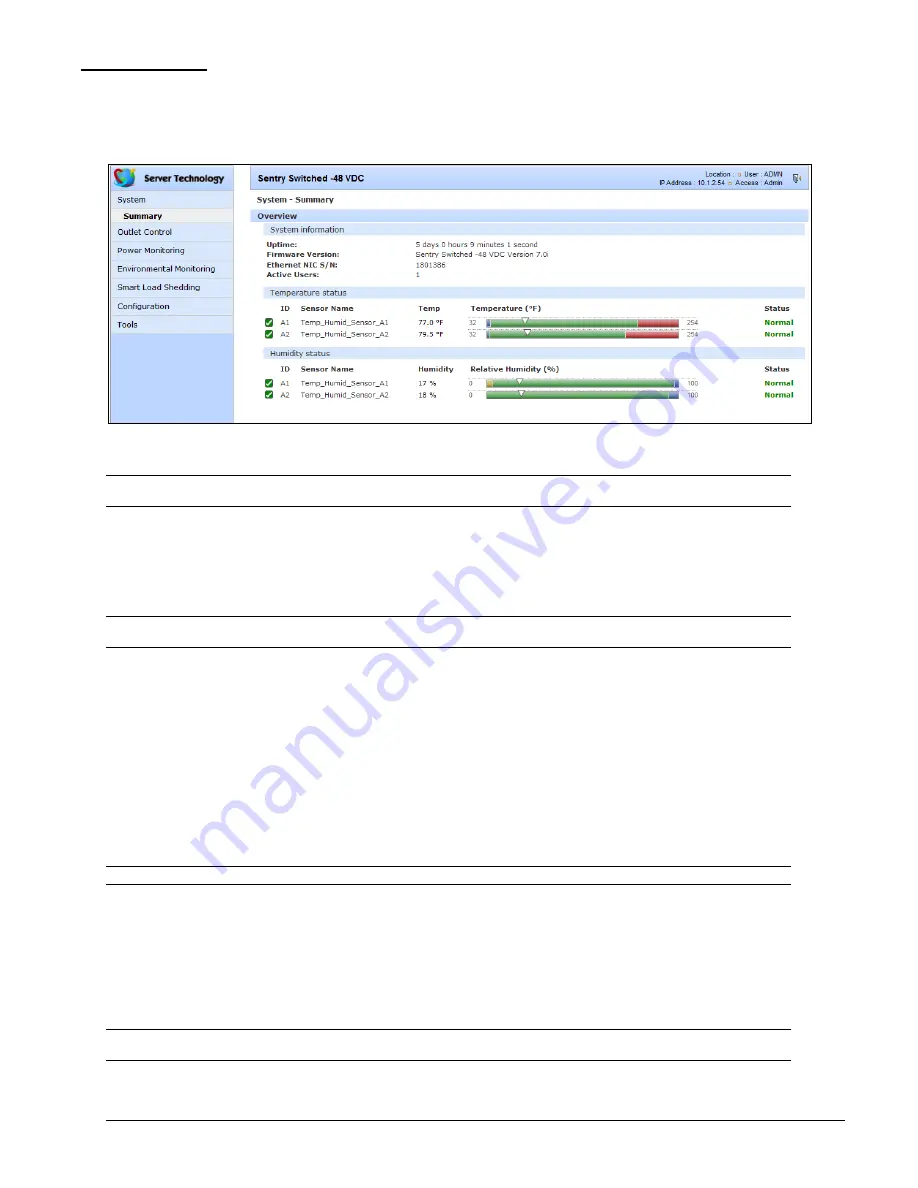
The System Summary page contains general temperature and humidity status information. The color-coded sensor
graphs shown in the example provide a real-time view for monitoring environmental conditions in your device
network.
Figure 3. Example of System Summary Page for the -48 VDC Remote Power Manager
NOTE:
The -48 VDC products do not have information on total power or input feed line status. The DC products also do not measure
voltage (for watt calculation).
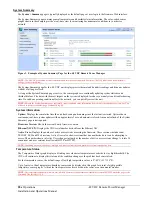
The System Summary page for the -48 VDC unit displays precise thermal and humidity readings and dynamic updates
without a full page refresh.
As long as the System Summary page is active, the sensor graphs are continually updating system statistics and
threshold values. The data with the most impact on the system is displayed to reduce your analysis and troubleshooting
time. If a sudden operating condition affects the network, you can quickly correct the unit.
NOTE:
Because the System Summary page continually requests updated status information from the unit, the page does not time-out. You
will need to navigate to another page or manually log off.
System Information
Uptime:
Displays the cumulative time the unit has been up and running since the last unit restarted. Uptime shows
continuous, real-time system updates with an approximate 5-second automatic refresh. A manual refresh of the System
Summary page is not required.
Firmware Version:
Shows the current Sentry firmware version.
Ethernet NIC S/N:
Displays the CDU serial number derived from the Ethernet NIC.
Active Users:
Displays the number of active user sessions accessing the firmware. These sessions include serial,
TELNET, SSH, and Web sessions. Active Users also shows sessions that an unauthorized user can be attempting to
access. The number shown in Active Users changes instantly as the number of active user sessions change. A total of 4
concurrent web user sessions are allowed (HTTP or HTTPS).
NOTE:
Depending on your web browser, multiple web accesses from the same machine are often treated as one user.
Temperature Status
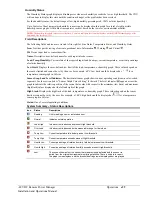
The Temperature Status graph displays a blinking error whenever temperature exceeds the low or high threshold. The
CDU will continue to display this state until the condition changes or the problem has been resolved.
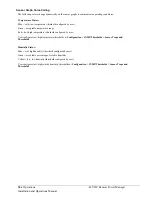
For the temperature sensor, the default range of low/high temperature values is 5º-45º C (41º-115º F).
Up to four sets of dual temperature/humidity sensors can be displayed in this graph for a total of eight possible
temperature sensor graphs. A thin blue line separates each set based on the tower or environmental monitor.
NOTE:
The temperature threshold values are user-defined. You must configure these threshold values on the SNMP/Thresholds page or the
Command Line Interface (CLI).

