27
5 SePem 01 Master
5.5.2.3 Analysing measurement result readouts
The measurement results read out during the patrol (see
, procedure to Step 3) must always be analysed
and critically assessed.
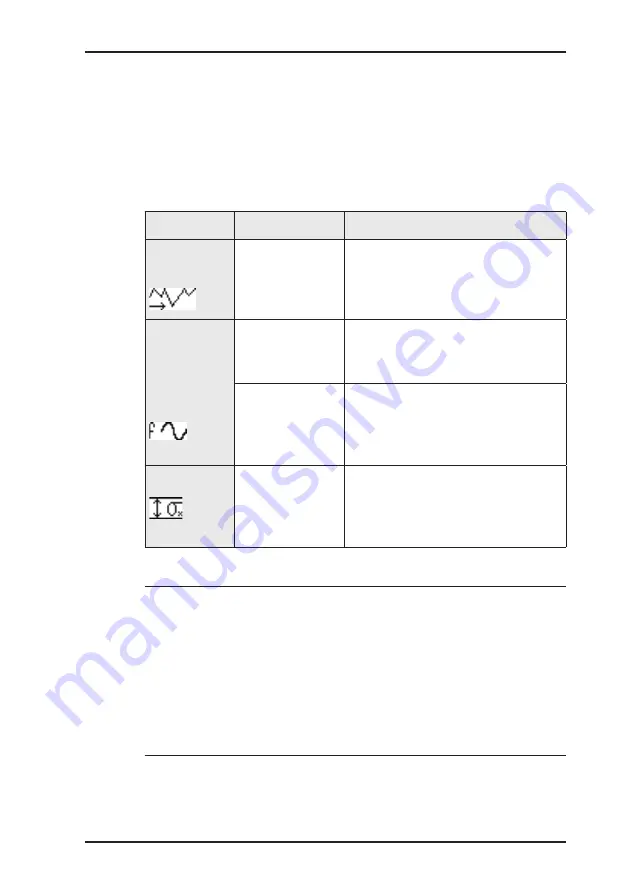
The following values give information about the quality of the
measurement and any leak:
Value
Indication of
Description
Minimum
sound level
Possible pres-
ence of a leak
●
Close to zero > no leak
●
Much greater than zero > pos-
sible leak
Character-
ising fre-
quency of
measure-
ment
Fault
●
50 Hz or 100 Hz > back-
ground noise > usually no
leak
Location of leak
●
Low > possible leak is some
distance away
●
High > possible leak is not far
away
Width
Quality of
measurement
●
Small > low inference noise >
good measurement
●
Large > high interference
noise > bad measurement
Note:
In the factory settings the
Characterising frequency of meas-
urement
column is hidden. To display the column you will have
to change the Master settings.
If graphics are required for analysing the measurement results
then the extended data set must be read out. In this case, the
patrol should be continued as per the Section 5.5.2.2 procedure
described from Step 5 onwards.
The following information is transmitted in addition to the meas-
urement results when data is read out:

