31
5 SePem 01 Master
Analysis of the graphics
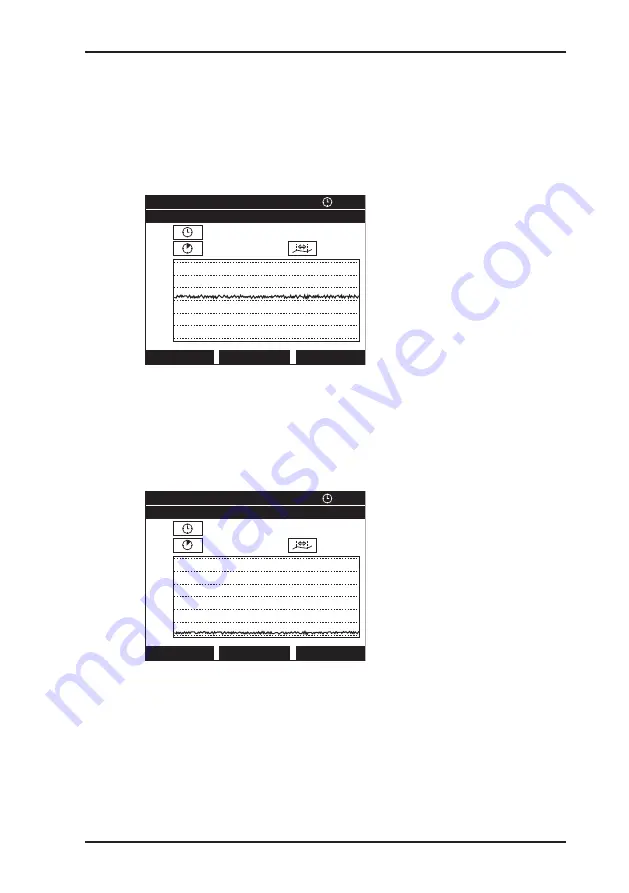
The x-axis corresponds to time, the y-axis is the measurement
value (noise level).
A noise level that is continuously much higher than zero may
indicate the presence of a leak (Fig. 9).
GRAPHICS
10:21
100 02 00821
Scroll
3000
2500
2000
1500
1000
500
0
12 Jan. 2010
0d 01h 00min
2 s
02:00:00
Back
Last Min.
Fig. 9: Graphics showing a high probability of a leak
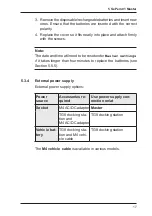
If the noise level is continuously close to zero then the proba-
bility of a leak is low (Fig. 10). Short, high peaks (spikes) may
indicate, for example, passing vehicles or water being withdrawn
for a short period.
GRAPHICS
10:21
100 02 00821
Scroll
3000
2500
2000
1500
1000
500
0
12 Jan. 2010
0d 01h 00min
2 s
02:00:00
Back
Last Min.
Fig. 10: Graphics showing a low probability of a leak


