22
5 SePem 01 Master
5.4.5
Scrolling in charts
The
Master
can display data in charts. The corresponding win-
dows are called
GRAPHICS
and
HIST. GRAPH
.
The charts always show all the data in one image. If there is a
large amount of data, the values will be compressed in the chart.
If you want to study individual values in more detail, you can view
the chart in scroll mode. Switch to scroll mode using
F2
Scroll
.
Use
F2
No scroll
to exit scroll mode again.
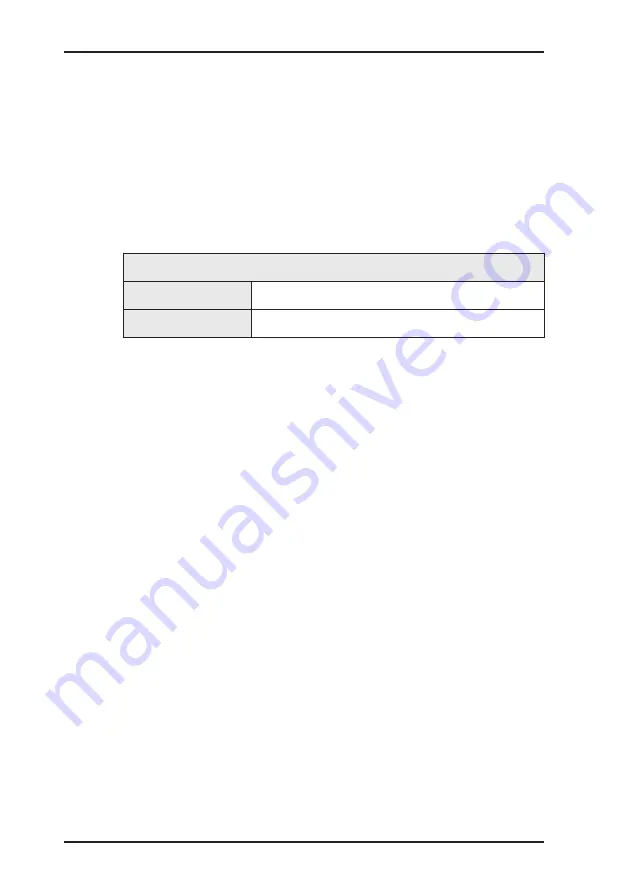
Function key F2
Scroll
Switch to scroll mode
No Scroll
Exit scroll mode
Information on scroll mode
A cursor appears in the chart in scroll mode. This can be moved
to the left and right by turning the jog dial.
Information relating to the respective cursor position (date and
time, current noise level) is displayed above the chart.
If there is a large amount of data available for a measurement,
i.e. when the values are compressed, there may be several val-
ues at one cursor position. In such cases, the highest and the
lowest noise level at the cursor position are shown with the cor-
responding time.


