background image

4

Chapter 1: Getting Started

SPACE

EN TRY

COMMUNICATION PORT

EXE

L

2

L

3

L

1

L

4

L

5

L

6

LIST

OPT ION

RCL

QUI T

SET UP

INS

sin

OFF

X / T

DRAW

CLIP

TBLSET

FORMAT

CALC

STAT PLOT

ANS

cos

tan

A LOCK

FRAC

INT

SHIFT   CHANGE

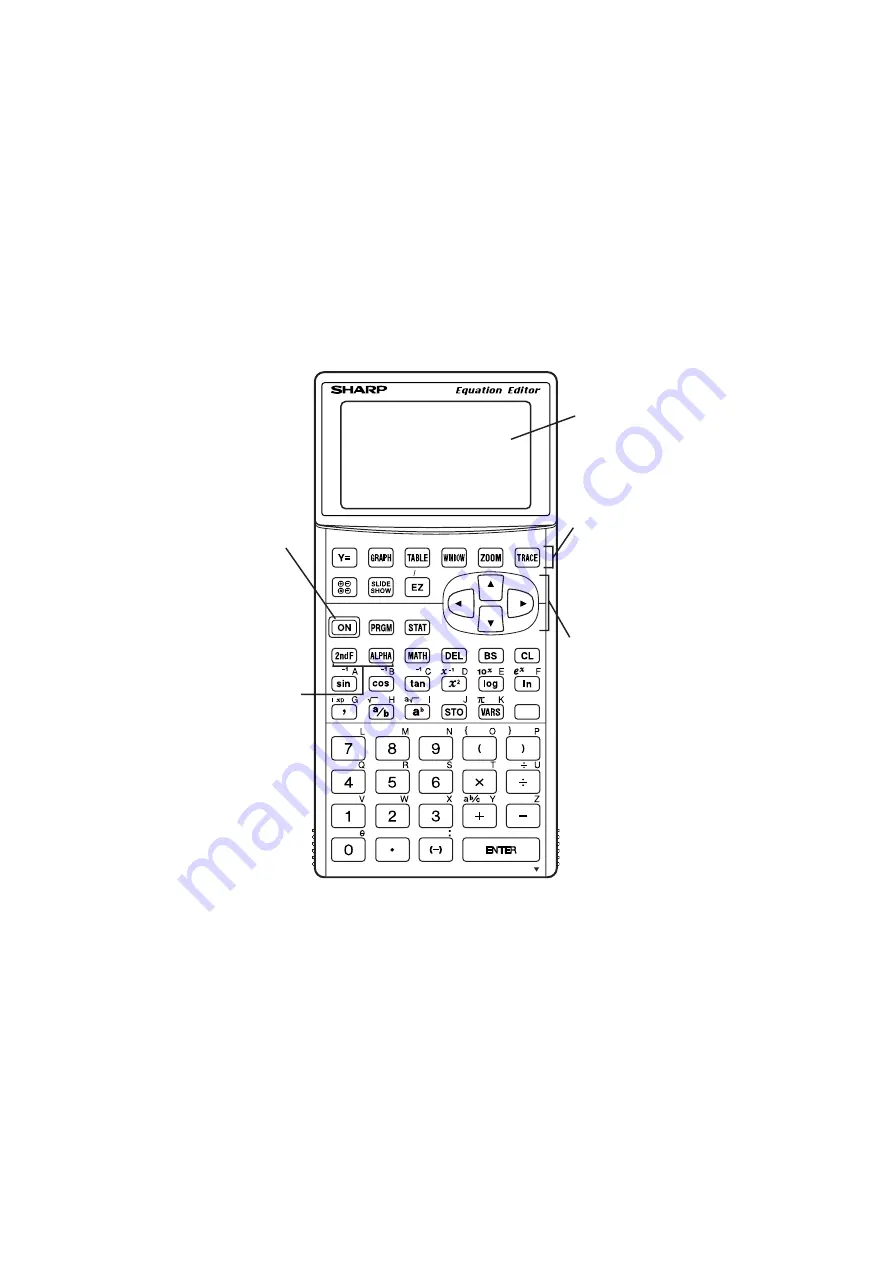
EL-9450

Part Names and Functions

1

Display screen

2

Power ON/

OFF key

5

Cursor keys

3

Key operation

keys

4

Graphing keys

Summary of Contents for EL-9450

Page 1: ...EL 9450 MODEL GRAPHING CALCULATOR OPERATION MANUAL ...

Page 2: ...separate permanent written records be kept of all important data Data may be lost or altered in virtually any electronic memory product under certain circumstances Therefore SHARP assumes no responsibility for data lost or otherwise rendered unusable whether as a result of improper use repairs defects battery replacement use after the specified battery life has expired or any other cause SHARP ass...

Page 3: ...ting Entries 14 Second Function Key 16 ALPHA Key 17 Math Function Keys 18 MATH STAT and PRGM Menu Keys 20 SETUP Menu 21 SETUP Menu Items 22 Error Messages 24 Resetting the Calculator 25 1 Using the RESET switch 25 2 Selecting the RESET within the OPTION menu 26 Chapter 3 Manual Calculations 27 1 Try it 1 27 Try it 2 29 2 Arithmetic Keys 30 3 Calculations Using Various Function Keys 32 4 Calculatio...

Page 4: ...e RENAME 95 Chapter 6 SHIFT CHANGE Features 96 1 Try it 96 2 SHIFT Feature 99 3 Change Feature 104 Chapter 7 List Features 107 1 Try it 107 2 Creating a list 109 3 Normal List Operations 109 4 Special List Operations 111 Calculations using the OPE menu functions 111 Calculations using MATH Menus 114 5 Drawing multiple graphs using the list function 116 6 Using L_DATA functions 117 7 Using List Tab...

Page 5: ...parison operands 143 5 Programming commands 143 A PRGM menu 143 B BRNCH menu 145 C SCRN menu 145 D I O menu 145 E COORD menu 146 F FORM menu 146 G S_PLOT menu 147 6 Flow control tools 147 7 Other menus convenient for programming 148 H COPY menu 148 VARS menu 149 8 Debugging 151 9 Sample programs 152 Chapter 10 OPTION Menu 154 Accessing the OPTION Menu 154 1 Adjusting the screen contrast 154 2 Chec...

Page 6: ...1 Arithmetic calculation 169 2 Function calculation 169 7 List of Menu Sub menu Items 173 1 MATH menus 173 2 LIST menus 174 3 STAT menus 175 4 STAT PLOT menus 176 5 DRAW menus 177 6 ZOOM menus 178 7 CALC menus 179 8 SLIDE SHOW menus 180 9 SHIFT CHANGE menus 180 10 FRAC menus 181 11 PRGM menus 181 INDEX 184 ...

Page 7: ...vi ...

Page 8: ... a car dashboard or near a heater and avoid exposing it to exces sively humid or dusty environments Since this product is not waterproof do not use it or store it where fluids for example water can splash onto it Raindrops water spray juice coffee steam perspiration etc will also cause malfunction Clean with a soft dry cloth Do not use solvents Do not use a sharp pointed object or exert too much f...

Page 9: ... unit will automatically start its own initialization sequence After a moment of WAIT message displayed on the screen the following message will appear PRESS CL TO CLEAR ALL DATA PRESS ON KEY TO CANCEL Note If the above message does not appear check the direction of the batteries and close the cover again If this does not solve the problem follow the instruction described in Resetting the Calculat...

Page 10: ... done press C to exit the mode To open the cover When in use When not in use Press o to turn the calculator off Automatic power off function The calculator is automatically turned off when there is no key operation for approximately 10 minutes The power off time depends on the conditions The calculator will not automatically power off while it is executing calculations flashes on the upper right c...

Page 11: ...E L2 L3 L1 L4 L5 L6 LIST OPTION RCL QUIT SET UP INS sin OFF X T DRAW CLIP TBLSET FORMAT CALC STAT PLOT ANS cos tan A LOCK FRAC INT SHIFT CHANGE EL 9450 Part Names and Functions 1 Display screen 2 Power ON OFF key 5 Cursor keys 3 Key operation keys 4 Graphing keys ...

Page 12: ...ode ALPHA LOCK 4 Graphing keys These keys specify settings for the graphing related mode Y Opens the formula input screen for drawing graphs G Draws a graph based on the formulas programmed in the Y window T Opens a Table based on the formulas programmed in Y W Sets the display ranges for the graph screen Z Changes the display range of the graph screen U Places the cursor pointer on the graph for ...

Page 13: ...key i Toggle input mode between insert and overwrite in one line edit mode Allows you to set up the basic behavior of this calculator such as to set answers in scientific or normal notation Menu and Function keys P Enter the programming menu S Enter the statistics menu d Draws items on the graph Use this key also to save or recall the graph pixel data M Enter the Math menu with additional mathemat...

Page 14: ...bove each key in yellow press first then press the key Press C to cancel To press the key printed above each key in blue press A first then press the key When in Menu selection screen however you do not have to press A to access the characters Press C to cancel If you want enter alphabetical letters blue sequentially use Press A to return to the normal mode In this manual alphanumeric characters t...

Page 15: ... you may calculate how many cups of warm milk are required for 1 doughnut 3 4 18 As for the ordinary calculation the answer is 0 041666666 But how much is 0 041666666 of a cup of warm milk The answer has three modes Decimal numbers Mixed num bers and Improp er numbers If the Mixed or Improp answer mode is selected in the SETUP menu you can obtain the answer in fractions Quick Run through Fraction ...

Page 16: ... and you do not have to reenter the value 6 Press b or directly multiplication Ans is displayed ANS is a calculator specific variable which indicates the answer of calculations just before When you enter addition subtraction multiplication division it is not required to press b Note The multiplication sign and the division sign will appear on the screen as and respectively 7 Press 60 8 Press E Ans...

Page 17: ...r 1 Getting Started You can toggle between decimal values mixed numbers and improper fractions using fraction menu 1 Press 4 E 2 Press 3 E 3 Press 2 E To a decimal value To an improper fraction To a mixed number ...

Page 18: ...e bottom four rows of the keyboard enable you to access the basic functions of the calculator 1 Entering numbers Use the number keys 0 9 decimal point key and negative number key _ to enter numbers into the calculator To clear the screen entry press C Example Type 10 23456789 onto the Calculation screen 1 Enter the Calculation screen then clear the screen entry C Number entry ...

Page 19: ...tive number key _ can be used to enter numbers lists and functions with negative values Press _ before entering the value Note Do not use the key to specify a negative value Doing so will result in an error Example Type 9460 827513 into the Calculation screen C _ 9460 827513 2 Enter numbers with the number keys and decimal point key as follows 10 23456789 Note can be used to enter a value in scien...

Page 20: ... automatically to different areas by various functions and tools or can be moved around by using the keys Use the cursor keys to select a menu item select an item in a list and trace along a graph Example Enter 65536 4 8 3 in the Calculation screen Then press E to calculate 1 Press then C to clear the display 2 Enter 4 for the root s depth then press _ The root figure is entered with the cursor au...

Page 21: ... key erases one BEFORE THE CURSOR Use C to clear the entire entry line Mode Symbol Remarks Normal mode The appearance of the cursor pointer may vary according to the mode or When A is pressed position The major shapes and the definitions are as follows When is pressed Insert mode Overwrite mode and appear at the insertion point within the functions such as a b and a The cursor also displays inform...

Page 22: ...ormation on the Y key refer to Chapters 4 of the manual Example Type 3096 then change 3 to 4 When done move the cursor to the very end of the numbers C 3 0 9 6 D 4 Example Type 4500000 then remove 500 C 4 5 0 0 0 0 0 B B B Tips You can jump the cursor to the beginning or the end of line by using the and keys Likewise if the cursor is at the very top of the stacked entry press to jump the cursor al...

Page 23: ...ures All functions associated with are color coded yellow and are printed above each key Example Enter 2π on the screen 1 Press C to clear the screen then enter 2 by pressing 2 2 Press When the key is released the cursor on the screen changes indicating that a second function is now ready to be called up 3 Press The entry appears on the screen ...

Page 24: ...and equation names from within the second func tions and various menus instead If a colon is used data may continue to be entered in more than one term Example Enter 2 A on the screen 1 Press C to clear the screen Enter 2 by pressing 2 2 To enter A press A the cursor pattern changes to A _ upon releasing the key 3 Press A to call A at the cursor After the entry the cursor pattern changes back to n...

Page 25: ...nction at the cursor t Enters an arc tangent function at the cursor y Enters 2 at the cursor to raise a number to the second power x Enters 1 at the cursor to raise a number to the negative first power l Enters a logarithm function at the cursor 0 Enters 10 to the xth power then sets the cursor at the x I Enters a natural logarithm function at the cursor Enters e constant to the power of x then se...

Page 26: ... a the depth R Stores a number or a formula into a variable r Recalls an item stored in a variable z Brings up the VARS menu Input π 3 14 figure z Input a variable X for rectangular or T for parametric i Gives an answer as a quotient and a remainder d Enters a mixed number Note If a number precedes d b a and _ then the number will be set as the first entry of the figure Else the first entry is bla...

Page 27: ... move the cursor up and down the menu As you scroll you will see the corresponding sub menu contents shown on the right side of the screen change 3 Set the cursor at B NUM Menu items can also be selected by using shortcut keys A through H in this example simply press B to select B NUM There is no need to use A for this operation 4 Press a shortcut key 2 to select 2 round The screen now goes back t...

Page 28: ...exit the SETUP menu press C Example Display the calculation result of 10002 in scientific notation 1 Press then Within the SETUP menu press C then 3 to select 3 Sci under the C FSE menu Tips Using the arrow keys move the cursor down to the C FSE position press E and then move the cursor down to the 3 Sci position Press E to select the sub menu item 2 The display goes back to the SETUP menu s initi...

Page 29: ...500 is displayed as 3 500000000E3 The decimal point can be set in the TAB menu Eng Answers are given in engineering notation with exponents set to be multiples of 3 100000 will be displayed as 100 0000000E3 and 1000000 will be shown as 1 000000000E6 The decimal point can be set in the TAB menu Note If the value of the mantissa does not fit within the range 0 000000001 to 9999999999 the display cha...

Page 30: ... approach default setting Oneline Formulas will be displayed on one line Notes Immediately after changing the EDITOR the calculator will return to the calculation screen and the following data will be cleared ENTRY memory Equations stored in the graph equation window Y Resetting to the default settings p E 1 will also clear the above data Expression of up to 114 bytes can be entered in the Equatio...

Page 31: ...ssage when a given command is handled incorrectly or when instructions cannot be handled correctly such that the task cannot be processed further Various types of error messages are given to inform users about the types of situations to be remedied For example performing the following key strokes 5 E will result in an error and the error message will be displayed In such a situation you can go bac...

Page 32: ...ress the RESET switch on the back of the unit Note Gently push the RESET switch with the tip of a ball point pen or a similar object DO NOT use a tip of a pencil or mechanical pencil a broken lead may cause a damage to the button mechanism 2 After a moment of WAIT message displayed on the screen the verification window will appear on the screen 3 Press C to clear all the stored data Press O to can...

Page 33: ...ESET sub menu items should appear on the right side of the screen 3 The first item 1 default will initialize only the SETUP and FORMAT settings while the second item 2 Allmem will erase all memory contents and settings To reset the memory select 2 Allmem by pressing 2 The verification window will appear 4 Press the C key to clear all data stored on the calculator Press any key to continue ...

Page 34: ... 7 and a half times within a second Suppose you are standing at the equator While the Earth rotates over the period of one day you also rotate around the globe at a certain speed Knowing the facts above can you figure out how fast you are travelling in miles per hour Since distance travelled average speed time taken the following equation can be formed to find out the circumference of the Earth x ...

Page 35: ...s thus obtained 3 Store the answer in a variable A variable is a symbol under which you can store a numerical value We will use variable A to store the circumference of the Earth Press R to set the store mode Press A A then E to store the answer To call up the stored answer press A A E again 4 Now since the value you have stored under A is the distance you will be travelling in 24 hours divide the...

Page 36: ...s 505 8 feet and the angle of elevation is 36 degrees then the following expression can be derived the height of the Mendocino tree ft 505 8 ft tan 36 CONCEPT 1 Verify change the calculator s angle unit 2 Use the calculator s trigonometric function key to enter perform the calculation PROCEDURE 1 Since the angle of elevation is measured in degrees the calculator s angle setting will need to be mat...

Page 37: ...xecutes an expression Example Calculate 1 2 C 1 2 E An expression is a mathematical statement that may use num bers and or variables that represent numbers This works just like a regular word sentence one may ask how are you and you may answer okay But what if an incomplete sentence is thrown such as how are You ll wonder how are what it just doesn t make sense A math expression needs to be comple...

Page 38: ... E Enters a multiplication sign Example Multiply 12 by 34 1 2 3 4 E Enters a division sign Example Divide 54 by 32 5 4 3 2 E The multiplication sign can be left out when a Placed in front of an open parenthe sis b Followed by a variable or a math ematical constant π e etc c Followed by a scientific function such as sin log etc When to leave out the sign ...

Page 39: ...tions such as round automati cally include an open parentheses Each of these functions needs to be closed with a closing parenthesis 3 Calculations Using Various Function Keys Note The default angle unit of this calculator is radians The example hereafter will therefore feature the radian angle system unless otherwise specified If you wish to change the angle system you can change the unit to degr...

Page 40: ...ple Obtain the answer to 122 12 y E Note When no base number is entered the base number area will be left blank and just the exponent appear C y 1 2 E l Enters a log function for a logarithmic calculation Example Calculate log 100 l 1 0 0 E I Enters a natural logarithm function Example Calculate In e4 I 4 E Enters a comma at the cursor A comma is required in some of the MATH functions For more inf...

Page 41: ...mple 2 5 indicates 2 5 a Enters an exponent setting the preceding number as its base Example Raise 4 to the 5th power 4 a 5 E Note When no base value is entered ab will be entered with both number areas left blank C a 4 5 E When calculating x to the power of m th power of n enter as follows Calculate 232 2 a 3 a 2 E The above calculation is interpreted as 232 29 If you wish to calculate 23 2 82 pr...

Page 42: ... 0 5 c 0 5 E t Enters an arc tangent function to be used in a trigonometric expression Example Calculate arc tangent 1 t 1 E Note Expressions with inverse trigonometric functions evaluate in the following ranges θ sin 1 x θ tan 1 x θ cos 1 x Deg 0 θ 90 Deg 0 θ 180 Rad 0 θ π 2 Rad 0 θ π Grad 0 θ 100 Grad 0 θ 200 z Accesses the VARS menu Refer to chapters 9 to learn how to use each item in this menu...

Page 43: ...number is entered x 1 will be entered with x left blank C x 1 2 E 0 Enters a base of 10 setting the cursor at the exponent Example Calculate 5 105 5 0 5 E Enters the Euler Number e 2 71 to a power The cursor will then be placed at the exponent Example Obtain a value of e3 3 E Enters a value in scientific notation Example Enter a value 6 3 106 6 3 10 6 E Enters a square root symbol Example Obtain t...

Page 44: ...ed with both number areas left blank C _ 5 4 E r Recalls a stored number Example Set C 8 8 R A C E Recall the value of C r A C E Enters pi Pi is a mathematical constant representing the ratio of the circumference of a circle to its diameter Example Enter 2π 2 E p Opens option menu See page 154 Enter braces to group numbers as a list ...

Page 45: ...he previous entry This is useful when you want to modify the previous entry rather than re entering the whole expression Example Calculate 4 6 4 6 E Next calculate 4 8 e B 8 E Note Executed expressions are stored in a temporary memory in the executed order If the temporary memory is full the oldest data is automatically deleted Be aware that e may not function on these occasions A maximum of 160 b...

Page 46: ... set to one line mode d enters integer fraction separator only Use d in combination with b as follows Enter 5 6 4 in one line mode 4 d 5 b 6 E Integer part of the mixed number must be a natural number A variable can not be used Equation or use of parenthesis such as 1 2 2 3 or 5 2 3 causes a syntax error While using the d key when a numerator or a denominator is negative the calculator will displa...

Page 47: ...est common factor of 12 and 6 1 E Simplified by 3 the lowest common factor of 6 and 3 1 Press 2 Press H 2 The answer of division will not simplify automatically Use Simp feature of FRAC menu to simplify the fraction 1 Press 2 For Mixed number mode press F 2 if Improper fraction mode is required press F 3 Press F 2 to select the Mixed number mode in this example 3 Press C To set the manual simplifi...

Page 48: ...r is set to a large digit integer 6 digit or more for example 2 a b c Converts an improper fraction to a mixed number Example Change 12 5 to a mixed number 12 b 5 2 E 3 b c Converts a mixed number to an improper fraction Example Change 2 5 2 to an improper fraction 3 E 4 A xxx Converts a fraction to a decimal number Example Change 12 5 to a decimal number 4 E Note The above three conversions will ...

Page 49: ...shortcuts It is also possible to select a sub menu item using the cursor keys 1 log2 log2 value Enters a base 2 logarithm log2 Example Calculate log2 32 M A 1 3 2 E 2 2X 2value Raises 2 to a power Sets the cursor to exponent Example Calculate 24 M A 2 4 E 3 fmin fmin equation lower limit of x upper limit of x Returns the value of variable x when the equation Y has the minimum value within the spec...

Page 50: ...per limit the number of divisions dx written as one line mode syntax Calculates an integral value of equation Y from the lower limit to the upper limit using the specified number of divisions if not specified default value is 100 Use in conjunction with the 7 dx sub menu item Example M A 6 2 8 z a 3 0 5 z y 6 10 M A 7 E The above key strokes are to be performed under the Equation edit mode 7 dx En...

Page 51: ... 0 5 E 2 round round value digit number of decimals Returns the rounded value of the term in parentheses A rounding point can be specified A real number a list variable or equation can be used as values Example Round off 1 2459 to the nearest hundredth M B 2 1 2 4 5 9 2 E 3 ipart ipart value Returns only the integer part of a decimal number A real number a list variable or equation can be used as ...

Page 52: ...closest integer Example Round down 34 56 to the nearest whole number M B 5 3 4 5 6 E 6 min min list Finds and returns the minimum value within a list of numbers To define a list of more than two numbers group the numbers with brackets and with each element separated by a comma Example Find the smallest value among 4 5 and 9 M B 6 4 5 _ 9 E 7 max max list Finds and returns the maximum value within ...

Page 53: ... Find the greatest common divisor of 16 and 36 M B 9 1 6 3 6 E 0 remain natural number remain natural number Returns the remainder of a division Example Obtain the remainder when 123 is divided by 5 1 2 3 M B 0 5 E C PROB Use the PROB sub menu items for probability calculations 1 random random number of trial Returns a random decimal number between 0 and 1 Example Make a list with three random num...

Page 54: ...ph will not match the graph s visual representation 2 nPr Returns the total number of different arrangements permutations for selecting r items out of n items nPr n n r Example How many different ways can 4 people out of 6 be seated in a car with four seats 6 M C 2 4 E 3 nCr Returns the total number of combinations for selecting r item out of n items nCr n r n r Example How many different groups o...

Page 55: ...utes and seconds 4 0 0268 M D 2 E The base 60 sexagesimal system as well as the minutes second measurement system was invented by the Sumerians who lived in the Mesopotamia area around the fourth millennium B C The notion of a 360 degrees system to measure angles was introduced to the world by Hipparchus 555 514 B C and Ptolemy 2nd cent A D about 5000 years later We still use these ancient systems...

Page 56: ...e mode 0 θ 180 Radian mode 0 θ π Grad mode 0 θ 200 Polar to rectangular coordinate conversion functions Conversion formulas x rcosθ y rsinθ 5 rθ x rθ x r coordinate θ coordinate Returns rectangular coordi nate X value from r θ polar coordinates θ r x y Rectangular to polar coordinate conversion functions Conversion formulas r x2 y2 1 2 θ tan 1 y x This calculator is equipped with rectangular coord...

Page 57: ...eding value in minutes 3 Inserts a second and sets the preceding value in seconds Example Enter 34 56 78 3 4 M E 1 5 6 M 2 E ANGLE remains selected 7 8 M 3 type the number to enter the E symbols 4 r Enters an r to enter a number in radians Example Type 2 radian 2 M E 4 E 5 g Enters a g symbol to enter a number in grads 6 rθ y rθ y r coordinate θ coordinate Returns rectangular coordinate Y value fr...

Page 58: ... value is larger than a following value 4 Tests whether a preceding value is larger than OR equal to a following value 5 Tests whether a preceding value is smaller than a following value 6 Tests whether a preceding value is smaller than OR equal to a following value G LOGIC Use the LOGIC sub menu items to perform logic calculation functions The following is the truth table of the combination of in...

Page 59: ...rns the answer 100 4 2 or value A or value B Enters an OR logic figure Example 7 OR 6 C 7 M G 2 6 E 7 decimals is converted to 111 binary and 6 to 110 OR will compare the two numbers digit by digit and returns the answer 111 7 3 not not value Enters a NOT logic figure Example NOT 4 C M G 3 4 E 4 decimals is converted to 100 binary NOT will calculate the given number digit by digit and returns the ...

Page 60: ... to 1100 binary and 6 to 0110 XOR will compare the two numbers digit by digit and returns the answer 1010 10 5 xnor value A xnor value B Enters an Exclusive NOR xnor logic figure Example 11 XNOR 8 C 11 M G 5 8 E 11 decimals is converted to 1011 binary and 8 to 1000 XNOR will compare the two numbers digit by digit and returns the answer 1111111111111100 4 ...

Page 61: ...e system Use the calculator s graphing capabilities to figure out the approximate point where the Orange Cab gets ahead of the Tomato Cab in terms of cost performance There are two taxi cab companies in your city Tomato Cab and Orange Cab with different fare systems The Tomato Cab charges 2 00 upon entering the taxi cab and 1 80 for each mile the taxi travels The Orange Cab on the other hand charg...

Page 62: ...wo equations in this exercise let s use Y1 and Y2 4 By default the cursor should be placed on the right side of the Y1 equation next to the equal sign If this is not so use the cursor keys to bring the cursor to the Y1 line then press the C key to clear any entries The cursor will automatically be placed to the right of the equal sign 5 Enter the first equation 2 1 8X to represent the Tomato Cab s...

Page 63: ...esents the Y value while X is represented by the horizontal axis It appears that the two diagonal lines cross at the point where the X value is somewhere between 2 and 3 indicating that Orange Cab costs less than the other after 3 miles of travelling 10 Next press T to find the values per graph increment When the travelling distance is 2 miles the Tomato Cab charges 30 cents less overall than the ...

Page 64: ...ion window Up to 10 equations can be entered in rectangular coordinate graph mode and UP to 12 equations can be entered in parametric coordinate graph mode After the graph expression is entered press E to store the equation The expression can be represented as a graph The expression cannot be drawn as a graph Move the cursor pointer to the sign and press E to change between to draw and not to draw...

Page 65: ...ximum X value When this item is selected the graph will automatically be redrawn Note The Auto sub menu item is directly affected by how the WIN DOW items are set up Refer to the W key section in this chapter to learn how to set up the Xmin and Xmax items 2 Box A box area can be specified with this sub menu tool so that the area within the box will be displayed full screen To select a box area to ...

Page 66: ...is scale is adjusted to the current X axis scale The graph will be redrawn automatically 7 Dec Sets the screen dot as 0 1 for both axes The graph will then be redrawn automatically 8 Int Sets the screen dot as 1 0 for both axes The graph will then be redrawn automatically 9 Stat Displays all points of statistical data set B FACTOR Use this menu to set the vertical and horizontal zooming factor The...

Page 67: ...ns a form of x D EXP 1 10X Use this tool when the equation contains a form of 10x 2 ex Use this tool when the equation contains a form of ex 3 log X Use this tool when the equation contains a form of log x 4 In X Use this tool when the equation contains a form of In x E TRIG 1 sin X Use this when the equation contains a sine function 2 cos X Use this when the equation contains a cosine function 3 ...

Page 68: ...ill not be stored with this tool G RCL Under this menu item there are two tools that enable the recalling of the previous graph window setup 1 RclWin On selecting this sub menu item the previously stored window setup will be recalled and the graph will be redrawn accordingly If no window setup has been stored previously the default graph window setup will be used 2 PreWin On selecting this sub men...

Page 69: ...will redraw the screen centered around the cursor 4 When done press the C key to escape the tracing function If more than one graph is displayed on the screen use the or keys to switch the cursor from one graph to the other Note If the U key is not activated the cursor will not be bound to the graph Pressing the or keys will position the free moving flashing cursor on the graph display Under the t...

Page 70: ...Enter the required value here 3 for example and press E Note The Xmax value cannot be set equal to or smaller than the value of Xmin If so done the calculator will display an error message upon attempting to redraw the graph and the graph will not be displayed 5 The next item Xscl sets the frequency of the X axis indices The default value is 1 If for example the value is set to 0 5 then indices wi...

Page 71: ...s the calculation range then will be displayed instead 2 Intsct With this tool the intersection s of two or more graphs can be found where the flashing cursor will be placed When the intersection is found then the X Y coordi nates of the intersection will be displayed at the bottom of the screen If there is more than one intersection the next intersection s can be found by selecting the tool again...

Page 72: ...X intercept can be found by select ing the tool again Note If the graph has no X intercept an error message will be displayed 6 Y_Incpt Finds an Y intercept of the given graph and places the flashing cursor at that position Note If the graph has no Y intercept an error message will be displayed 7 Inflec Calculates the inflection point of the given graph and moves the cursor to that point Example 1...

Page 73: ...e B POINT menu item A DRAW The tools in this menu add lines circles additional graphs and text on the graph screen The tools below can be accessed from the GRAPH window or any other windows such as the Graph Equation Entry window and Calculation screen Most of these tools such as Line can be entered directly onto a graph from the cursor point 1 ClrDraw Clears all items on the graph window EXCEPT f...

Page 74: ...Select A DRAW in the menu then select 2 Line Line will appear Suppose you wish to draw a line starting from an X Y coordinate 1 2 to end at 8 8 2 Enter 1 2 8 8 right after the Line object then close the expression with 3 Press E The GRAPH window will appear with the specified line drawn on the graph Note If you enter 0 for the 5th element of Line function e g Line 1 2 8 8 0 and press E you can cle...

Page 75: ... the line Note The pixel increment can be set within the ZOOM menu While A ZOOM is selected choose 7 Dec to set each pixel size to 0 1 0 1 or 8 Int to set to 1 1 4 When the starting point is set press E to anchor the location 5 Move the cursor to indicate the end point of the line When set press E to finalize the line drawing 6 You may draw as many lines as you wish by repeating the procedure from...

Page 76: ...line on the graph window V_Line x value Draws a vertical line x value on the graph window Example Draw a horizontal line of x 3 1 Press d A 4 and enter the value 3 H_Line y value Draws a horizontal line y value on the graph window Example Draw a horizontal line of y 5 1 Press d A 3 and enter the value 5 3 H_line Draws a horizontal line on the graph window From the GRAPH window From the Calculation...

Page 77: ...int 1 Select T_Line 2 Use to move the flashing cursor on the targeted graph line Use to select a graph to draw the tangental line 3 When the point is set at the tangent point press E V_Line Example Draw a vertical line manually 1 Press d A 4 2 Use the cursor navigation keys to move the flashing cursor to the appropri ate position 3 Press E to draw the line 5 T_line Draws a tangental line at the sp...

Page 78: ...Draws two graphs and shades the area between the two If the x range is specified it shades the area within the specified range Example Shade the area enclosed by y 1 4 x2 8 and y x 1 Select Shade 2 Enter 1 4 x2 8 x on the line 3 Press E Example Shade the area enclosed by y 1 4 x2 8 and y x within the range of 2 x 3 Before starting operation Select ClrDraw to clear the graphs previously drawn 1 Sel...

Page 79: ...te of center y coordinate of center radius Example Draw a circle with center at 2 3 and of radius 7 1 Select Circle 2 Enter 2 3 7 on the line 3 Press E Note Before drawing a circle press Z A 6 to set the X Y coordinates to square Circle Example Draw a circle manually 1 Select Circle 2 Move the cursor to set the center point of the circle Press E to set the anchor 3 Move the cursor to determine the...

Page 80: ...ed as pictures Therefore they cannot be traced Graphs drawn by the Draw menu are automatically cleared if any screen settings are changed To save the graph use the StoPict menu B POINT Utilize these tools to manage point drawing and deletion on the graph There are two operation methods One is to directly move the cursor pointer to the location on the graph screen where you wish to insert the point...

Page 81: ... coordinate y coordinate Changes the status i e visible invisible of a pixel at a given coordinate Deletes the point when it is displayed and draws the point when it is not displayed 4 PxlON PxlON column row Draws a pixel point at a given screen location indicated by column and row The column and row definitions are as follows Column 0 to 94 Row 0 to 64 0 0 94 0 0 62 94 62 column 96 This area cann...

Page 82: ... 9 1 DrawON DrawON equation number 1 or DrawON Sets the specified graphs visible If no argument is given then all graphs will be set visible 2 DrawOFF DrawOFF equation number 1 or DrawOFF Sets the specified graphs invisible If no argument is given then all graphs will be set invisible Example Set Y1 and Y2 to visible and Y3 to invisible 1 Press d C 1 2 Enter 1 2 for equation numbers 3 Press E 4 Pr...

Page 83: ... F PICT instead 2 RclGD RclGD number 0 9 Recalls the saved graph data Example Call back the previously stored graph data from location 1 D LINE Sets the line appearance of each graph Each graph coordinate mode can retain a set of line appearance preferences Solid line dotted line bold line locus and dots can be selected 1 Press d D to select D LINE then press E 2 The next window enables you to sel...

Page 84: ...isplayed pixel data for the graph window The graph equations will not be saved or recalled with these tools 1 StoPict StoPict number 0 9 Saves the pixel data Example Store the current graph including the drawings in location 1 2 RclPict RclPict number 0 9 Recalls the saved pixel data Example Call back the previously stored graph data from location 1 ...

Page 85: ...ct G SHADE The SHADE sub menu appears 3 Press 1 to select 1 SET The Set shade window appears 4 Using the cursor keys move the cursor pointer to the appropriate position 5 Press or to set Y1 on the left side of Y 6 Press the G key The graph will be redrawn 7 Let s add another inequation so that the area where the two inequal ity overlap can be shaded Press the Y key and enter another simple graph e...

Page 86: ...aph screen in the trace mode etc To display the equations on the graph select 1 ON by pressing 1 at this menu item C Y The numeric derivative dx dy can be displayed on the graph screen in the trace mode etc To activate this function select 1 ON by pressing 1 at this menu item D STYLE1 1 Connect To connect calculation points of a graph equation to create a graph Line indication 2 Dot Displays calcu...

Page 87: ...2 to select 2 Param Be sure that the other settings are as shown on the right To exit the SETUP menu press C 3 Press Y to go to the Graph Equation Entry window 4 Enter 16cos t for X1T Press E when done entering 5 Enter 9sin t for Y1T Press E when done entering Note The right side variable is automatically set to T When the z key is pressed within the Graph Equation Entry window it will enter the v...

Page 88: ... table The variable X is always displayed in the left end column The 10 digit value in the column where the cursor is currently located is displayed on the bottom line of the screen Move the cursor using Non input equation numbers and equations invalid for graphing will not be displayed in the above table Parametric coordinate system The variable T is displayed in the left end column The columns X...

Page 89: ...h TableStart and TableStep inputs can be made when selecting User set values will be ignored Press or to switch between Auto and User TableStart is a start value of the variable in the table and TableStep is a step value of the variable Both are numeric values Example Automatically create a table starting from 5 with a step of 1 in the X Y coordinate after equations based on Y1 X Y2 X2 and Y3 X2 3...

Page 90: ...quation entry and window and zoom settings easy Press f to enter the rapid feature mode and you can easily enter an equation or set the settings by using the pre installed equations or settings 1 Rapid GRAPH You can select a desired equation from the pre installed list of equations to draw a graph This feature is valid only in the rectangular coordinate system If you press f in the other coordinat...

Page 91: ...3 2 Y 1 2 X3 3 Y X3 2 4 Y X3 2X2 5 Y 2X3 X2 3X 1 Y 2 X 1 3 3 1 Y 1 X 2 Y 1 X 1 Y 1 X 2 1 Y 1 X 2 1 Y 2X 3 X 2 1 Y 2X 3 X 2 1 Y 2X 1 X 1 1 Y 2 X 1 2 3 1 Y X 1 Y X 1 Y 2X 1 1 Y X 3 4 1 Y 3 X 1 Y X 2 Y 2 X 1 3 Y 2 X 1 A Y AX2 B Y AX2 B C Y A X H 2 K D Y AX2 BX C A Y BX A Y logX B Y Alog X H K C Y AIn X H K A Y Asin BX H K B Y Acos BX H K C Y Atan BX H K A Y AX3 BX2 CX D B Y A X H 3 K A Y A X B Y A X ...

Page 92: ...ropriate position using and press E to select the equation classification menu The equation classification sub menu will appear 4 Move the cursor to A to select the sine graph and press E The pre installed equation menu will appear Press C to return to the initial Rapid GRAPH screen 5 Select the appropriate equation 1 for this case and press E The equation is displayed in one line If the line is e...

Page 93: ... pre installed typical window settings Regardless of the coordinate system this function sets the X and Y values only Example Set the X Window to 10 X 1 scl 1 and Y Window to 10 Y 1 scl 1 1 Press W to open the window screen The default settings will appear The settings may vary according to your previous operations 2 Press f A window setting main menu will appear where Roman numerals indicate quad...

Page 94: ...apid WINDOW 4 Press 5 E to select 10 X 1 scl 1 The Y Window selection screen will appear The settings displayed on the top line followed by C indicates the current settings If you select A AUTO the Y settings are set to the corresponding settings to X settings 5 Press 4 E to select 10 Y 1 scl 1 6 Press E to draw the graph 7 Press q to return to the calculation screen Note If you press C during the...

Page 95: ... differ from the actual display 1 Press G to display the graph 2 Press f A frame will appear at the center The graph is displayed with its size reduced icon at the top bottom left right of the screen each indicates that the value is increased each time when you press E icon at the top bottom left right of the screen each indicates that the value is decreased each time when you press E 3 Select by ...

Page 96: ...for major equations are pre installed under the A B IN menu You can select one from the sub menus and execute the slide show Original Slide Show You can create and register one original slide show program that can be recalled from the B ORG menu 1 Press The Slide Show menu screen will appear A B IN Selects and recalls a built in slide show program B ORG Recalls your original slide show program C N...

Page 97: ... same number The nearest squares to 6006 to one significant figure are 70 70 4900 and 80 80 6400 The latter is actually nearer to 6006 so the numbers sought are nearer to 80 than 70 The only last digit combinations leading to their products having 6 in the units column are 2 3 and 7 8 Find the answer using the calculator 1 Press to enter the SLIDE SHOW menu 2 Press C E to select C NEW 3 Name your ...

Page 98: ... n Note Images cannot be captured while drawing If the cursor flashes at the upper right corner of the screen the calculator is busy processing tasks The SLIDE SHOW feature cannot capture images during this period A captured image cannot be recaptured 5 Press n The message STORE SCREEN 01 will appear The image will be stored on page 1 of the SLIDE SHOW CNSCTV N and the screen will automatically re...

Page 99: ... Move the cursor to select A B IN using and press E Playing back the original SLIDE SHOW 1 Press to go to the SLIDE SHOW menu Press B to select B ORG The saved SLIDE SHOW name will be shown 2 Press E The first page of the SLIDE SHOW will appear The number appearing at the upper right of the screen is the slide number 3 Use the key or E to display the next image press the key to show the previous i...

Page 100: ...ress again The above two graphs are displayed simultaneously and the Y value column of the table is changed to show the Y1 Y2 values where you can find the relationship between Y1 and Y2 is totally constant Y1 Y2 1 6 Press to proceed the slide show Note If you wish to display the previous screen press is not effective on the first screen and is not effective on the last screen The number of screen...

Page 101: ...e you press n the screen image will be captured and registered in the current slide show Note If an original Slide Show has been already stored the delete confirmation display appears after selecting C NEW Press E to delete the previous Slide Show file Press q to cancel 4 Viewing the Original Slide Show To view the original slide show which was created previously follow these steps 1 Press B B ORG...

Page 102: ... you wish to move and press E 3 Press or to select the place you wish to move to and press E 4 Press q to exit the MOVE mode 2 Deleting the registered screen DEL This sub menu tool deletes the selected image captured in the slide show 1 Press D 2 2 Press or to select the screen you wish to delete and press E 3 Press q to exit the DEL mode 3 Renaming the registered title RENAME This sub menu tool l...

Page 103: ...ature and six graphs for the CHANGE feature The graph and the corresponding equation can be displayed on the same screen in order to easily view the relationship between graph and equation The calculator can temporarily store the graph locus that is shifted or changed its shape All the built in SHIFT CHANGE features are in the rectangular coordinate system regardless of the current coordinate syst...

Page 104: ...wer half of the right window Press to continue to shift the graph 2 Press A 1 to select 1 Y X2 in the SHIFT feature The graph of Y X2 will appear on the left window The corresponding function will be displayed on upper half of the right window The lower half displays the registered functions during operation The cursor will appear on the vertex of the graph SHIFT standby mode The four arrows of th...

Page 105: ...aph will change into a dotted line The new function corresponding to the graph Y X2 2X2 will appear on the right window upper half 7 Press 1 to select 1 Y X2 in the CHANGE feature The graph of Y X2 will appear on the left window The corresponding function will be displayed on upper half of the right window The lower half shows the registered function during operation The cursor will appear on the ...

Page 106: ...n Shift step Shift range 1 Y X2 X 1 X 3 to 3 Y 1 Y 2 to 3 2 Y X 1 X 2 to 4 Y 1 Y 2 to 3 3 Y 1 X X 1 X 4 to 2 Y 1 Y 3 to 2 4 Y ex X 1 X 3 to 3 Y 1 Y 3 to 2 5 Y In X X 1 X 4 to 2 Y 1 Y 2 to 3 6 Y sinX X 90 X 270 to 270 DEG Y 1 Y 2 to 3 Y sinX X π 2 X 3π 2 to 3π 2 RAD Y 1 Y 2 to 3 Y sinX X 100 X 300 to 300 GRAD Y 1 Y 2 to 3 7 Y tanX X 45 X 135 to 135 DEG Y 1 Y 2 to 3 Y tanX X π 4 X 3π 4 to 3π 4 RAD Y...

Page 107: ...ifted graph is drawn in the solid line The upper right portion of the screen shows how the equation is changed according to the graph shift In this case it says Y X2 is changed to Y X2 1 The cursor position is also shifted in the same direction and the cursor icon will be changed to the four arrow type indicat ing that shift feature is now in the standby mode The equation of the graph before shift...

Page 108: ... graph is shifted to the right by 2 increments and the equation is changed from Y X2 1 to Y X 2 2 1 The graph for Y X2 1 is changed to the dotted line 7 Press E to register the equation graph Y X 2 2 1 The registered equation X 2 2 1 is added to under Y X2 on the bottom half right screen Up to ten equations 1 to 9 and 0 including the base equation Y X2 can be registered 8 Press to further shift th...

Page 109: ...d at 1 X2 and the corresponding graph is displayed in a solid line Other graphs are displayed by dotted lines Note This operation clears equations that have not been registered in the previous operations 12 Press to move the cursor to 2 X 2 2 1 The corresponding graph Y X 2 2 1 is changed to the solid line and other graphs are displayed by dotted lines 13 Press to move the cursor to 3 X 2 2 The co...

Page 110: ...the graph shift screen Therefore if the equation Y X 2 2 1 has been selected 2 X 2 2 1 that equation becomes a base equation To return to the previous screen from the SHIFT feature Press C to return to the initial screen when a desired equation has been selected by pressing A and 1 8 Press q to return to the calculation screen Note that above key operations clear the shifted or registered equation...

Page 111: ...ose used in the SHIFT feature The following shows the built in equations change steps and movable range applicable to the change feature Including the trigonometric functions for different angles No Equation Change step Range for change 1 Y X2 X 1 Y 2 to 3 Y 1 2 Y X 1 Y 2 to 3 Y 1 3 Y X X 1 Y 2 to 3 Y 1 4 Y ex X 1 Y 2 to 3 Y 2 718 5 Y sinX X 90 Y 2 to 3 DEG Y 1 Y sinX X 1 57 Y 2 to 3 RAD Y 1 Y sin...

Page 112: ...will appear toward the cursor Numeric values displayed on the bottom of the screen show how the x y coordinate will be changed according to the graph change The right example shows that you wish to change the graph of Y X2 passing the coordinate 1 1 to the graph passing 1 2 3 Press E The new graph is displayed by a solid line and the cursor moves the location to the targeted coordinate 1 2 The rig...

Page 113: ...ess to move the cursor Basic operations are the same as those described in the SHIFT feature Refer to the page 102 for details To return to the change screen from the graph regeneration screen Press A To return to the previous screen from the CHANGE feature Press C to return to the initial screen when a desired equation has been selected by pressing B and 1 6 Press q to return to the calculation s...

Page 114: ... speed in miles per hour The braking distance 0 06 times the speed squared y 1 1 v 0 06 v2 where y represents the total stopping distance in feet and v represents the speed miles hour Calculate the total stopping distances at the speeds of 30 40 50 60 70 80 miles per hour CONCEPT 1 You can calculate all answers individually but if you use list you can obtain the results with one calculation PROCED...

Page 115: ...s hour 87 feet 40 miles hour 140 feet 50 miles hour 205 feet 60 miles hour 282 feet 70 miles hour 371 feet 80 miles hour 472 feet 4 Press R 1 5 Press E to store the list in L1 6 Press 1 1 1 0 06 1 y 7 Press E 8 List 87 140 205 282 371 472 will appear shows that results extend beyond the display to the right Use to scroll left or right respectively So the solutions are Store the list in L1 Enter th...

Page 116: ...ored sets as re quired 1 Press C to enter the calculation screen 2 Press 1 3 2 9 3 Press R 1 4 Press E to store the list in L1 5 Press 5 4 6 3 R 2 E for L2 Tips To view a specific list press 1 to 6 then E at the calculation screen 3 Normal List Operations Lists can contain real numbers Lists can be used as values or variables in calculations or equations Calculations between lists are also possibl...

Page 117: ...espectively 3 Press 1 2 E 4 Press _ 3 R 1 3 A 1 E 5 Press 7 R 1 5 A 1 E Note Separated by a colon two or more commands can be entered in one line 6 Press 2 E Calculate 10 L1 and store the results in L3 Calculate the sine of L3 Calculate L1 L2 Change the 3rd element of L1 to 3 Append the new value 7 to L1 as the 5th element Calculate the root of L2 ...

Page 118: ...1 in ascending order 2 sortD sortD list name Sorts lists in descending order Example Sort the above list L1 in descending order Note sortA list name 1 subordinate list name 1 If two or more lists are entered separated by commas a sort is performed on the first list as a key and the following lists are sorted in the order corresponding to the elements in first list key list Example Store lists 2 7 ...

Page 119: ...ied number Example Set the dimension of list L6 to 4 All the elements are initially 0 This operation overwrites the existing list dimensions The existing values within the new dimensions remain as they are 4 fill fill value list Enter the specified value for all the items in the specified list The dimension of the list must be set beforehand Example Set the dimension of list L6 to 4 and substitute...

Page 120: ... increment is omitted the default value 1 is used 6 cumul cumul list Sequentially cumulates each item in the list li l1 l2 li where li is the i th item of the list Example Set the list L1 to 4 2 7 and obtain the cumulated list L1 Cumulate the above result 7 df_list df_list list Returns a new list using the difference between adjacent items in the list li li 1 li where li is the i th item of the li...

Page 121: ...sts L1 and L2 will be assumed to be L1 2 8 4 L2 3 4 1 1 min min list Returns the minimum value in the list Example Calculate the minimum value of the list L1 2 max max list Returns the maximum value in the list Example Calculate the maximum value of the specified list L2 Note min list 1 list 2 max list 1 list 2 If two lists are specified in parenthesis separated by a comma then a list consisting o...

Page 122: ...2nd items of the list L1 sum L1 2 means sum all items from the second to the last of the list L1 6 prod prod list start number end number Returns the multiplication of items in the specified list Example Calculate the multiplication of items in the list L1 You can specify the range of items in the list to multiply prod L1 1 2 means multiply the 1st to 2nd items of the list L1 prod L1 2 means multi...

Page 123: ...he variance of the specified list items Example Calculate the variance using the list items of list L2 Standard deviation and variance Standard deviation s Variance where n number of list items lk list item value m mean value of the list Variance n 1 lk m 2 k 1 n 5 Drawing multiple graphs using the list function Using list items as coordinates you can simultaneously draw multiple graphs 1 Press Y ...

Page 124: ... Enter the equation as follows Y1 L1x2 L2x L3 6 Using L_DATA functions The calculator can store up to 10 list groups in memory L_DATA 0 to L_DATA 9 You may store or recall any one of these list groups Each list group can contain up to 6 lists 1 StoLD StoLD natural number 0 9 Stores the current group of lists L1 to L6 in L_DATA 0 to 9 Example 1 Press l and select C 1 2 Enter the preferred number fr...

Page 125: ...ts of the lists Though the STAT menu was originally designed for Statistics function calculations the List Table is very useful for entering or editing list items How to enter the list 1 Press S A E The list table will appear The first column indicates the order number of each list and the 2nd column corresponds to the list L1 the 3rd to the L2 and so on 2 Move the cursor to the target cell and en...

Page 126: ...new value and press E The new value will be stored in the target cell The display on the bottom line relates to the cell where the cursor pointer is located Though any number can be entered in a cell the bottom line of the screen can display up to a maximum of 10 digits excluding exponents and the cell can display up to a maximum of 8 digits including exponents ...

Page 127: ...nk and the cursor pointer is located at L1 1 top left Hours 01 02 03 04 05 06 07 08 09 10 11 12 13 14 15 16 17 18 19 20 21 22 23 24 Sunday 98 72 55 3 6 24 15 30 59 72 55 43 21 10 150 151 135 108 204 253 232 251 75 30 Monday 32 8 12 2 4 19 32 72 95 91 123 201 184 108 95 72 45 38 75 111 153 90 84 35 The following statistical and regression features are available Statistical calculations such as mean...

Page 128: ...e procedure to the end of the data 11 Press to move the cursor to the top line of L3 12 Input 32 for hour 01 and press E 13 Continue the procedure to the end of the data 1 Press or to move the cursor pointer to the target cell To jump the cursor at the beginning or the end of the list use the key in tandem with a cursor key 2 Input the correct number and press E Now we can plot the data to make hi...

Page 129: ...ress to move the cursor to the next line ListX 7 The default list name for ListX is L1 If another list name is set press 1 to enter L1 8 L1 is set to be used for x axis items 9 Press to move the cursor to the next line Freq 10 Press 2 to enter L2 11 Press to move the cursor to the next line GRAPH 12 The graph format defaults to histogram so if that is what is required this does not need to be chan...

Page 130: ...g menu will appear 2 Enter the values as shown in the diagram to the right Ymax is determined by the maxi mum access number 253 at 20 00 on Sunday 3 Press G You can compare up to 3 statistical data by setting PLOT2 PLOT3 to on Compare the access rates on Sunday and Monday 1 Press A E and move the cursor to GRAPH 2 Press again 3 Press B and 1 broken line with dots 4 Press G The histogram is now cha...

Page 131: ...s A EDIT Provides the entry or edit mode and displays a list table B OPE Calculation menu for operations such as ascending or descend ing sort C CALC Obtains statistical values D REG Calculates regression curves Use a list table to enter the statistical data press S to access Up to 999 elements can be used for each list though the amount of data able to be entered will vary according to the memory...

Page 132: ... x n Sample number xmin Smallest value of sample x Q1 First quartile of sample x Med Median of sample x Q3 Third quartile of sample x xmax Largest value of sample x 2_Stats 2 variable x y statistical calculations The following values are added to the 1 variable statistic calcula tions y _ Mean of sample y sy Standard deviation of sample y σy Population standard deviation of sample y Σy Sum of samp...

Page 133: ... on the top line of the screen followed by the cursor 3 Press 2 to enter L2 and press E All the statistical values will be displayed on the screen 4 Press or to scroll the screen 5 Press S to display the statistics menu 6 Press C and then 1 1_Stats will be displayed on the bottom line of the screen followed by the cursor 7 Press 3 to enter L3 and press E Hours 01 02 03 04 05 06 07 08 09 10 11 12 1...

Page 134: ...OINT POINT POINT Histogram Broken line plot Normal probability plot Normal distribution plot Box plot Modified box plot Pie chart Scatter diagram XY line 3 Graphing the statistical data Press to access the statistical graphing mode The calculator can plot statistical data on up to 3 types of graph PLOT1 to PLOT3 to check the state of distribution The graph types can be selected from histogram brok...

Page 135: ...esents each class value in the histogram The calculator can draw both a histogram and a broken line plot at the same time Plots the variance of the standardized normal distribution with the statistical data x on the X axis or Y axis If the points plot almost linearly it indicates that the data is of normal distribution The distance between the dots is set by the Xscl The Xscl can be changed betwee...

Page 136: ...of sample x A The minimum value xmin of the sample x B The tip of extension which is defined by Q3 Q1 x 1 5 C The first quartile Q1 D Median Med of the sample x E The third quartile Q3 F The tip of extension which is defined by Q3 Q1 x 1 5 G The maximum value xmax of the sample x Statistical data on the outside of the extension are indicated by points selectable from three types of points The leng...

Page 137: ...rements Pie graph of sample x Maximum number of division is 8 Calculation range 0 x 10100 Data can be displayed in two modes Value display 7 digits Percentage display Fixed decimal 2 digits decimal Pie graphs are drawn in the same order as on the specifying list Pie graphs cannot be displayed simultaneously with other graphs and X Y axis though lines or dots can be drawn The coordinates of the fre...

Page 138: ... menu is used to set the upper and lower limit lines of sample x of the statistical graph 4 Press 1 1 SET 5 Enter the appropriate value for Lower limit and press E 6 Enter the appropriate value for Upper limit and press E 7 Press D D LIMIT and press 2 2 LimON E to display a line that indicates the mean value of sample x as well as the upper and lower limit lines 8 Press D 3 3 LimOFF and E not to d...

Page 139: ... 2 Use or to move the cursor pointer to trace the graph curve How tracing is done After pressing U the cursor pointer will appear on the top left corner of the first bar If you press or the cursor pointer sequentially jumps between top left corners of the bars X and Y values are displayed at the bottom line of the screen Use or to change between graphs to trace After pressing U the cursor pointer ...

Page 140: ... the sortD menu item in List func tions See page 111 for details 3 SetList SetList list name 1 list name 2 Changes the list order as specified Example To change the order of lists in order of L2 L3 L1 Press E to execute Each list must be separated by a comma If only a single list name is specified the specified list moves to the left end of the table After changing the list order execute SetList w...

Page 141: ...ession Formula y ax b Parameters a b r r2 03 a bx Rg_a bx list name for x list name for y frequency list equation name to store Finds the regression line linear regression Formula y a bx Parameters a b r r2 04 x2 Rg_x2 list name for x list name for y frequency list equation name to store Finds the regression line using the second degree polynomial quadratic regression Formula y ax2 bx c Parameters...

Page 142: ... y abx Parameters a b r r2 08 aebx Rg_aebx list name for x list name for y frequency list equation name to store Finds the regression curve using the Euler exponential function Euler exponential regression Formula y ae bx Parameters a b r r2 09 x 1 Rg_x 1 list name for x list name for y frequency list equation name to store Finds the regression curve using the reciprocal function recipro cal regre...

Page 143: ...imated value of x given y 140 1 Enter the above data into L1 x and L2 y and execute regression menu 02 ax b L1 L2 2 Press 140 S D 1 1 E 12 y value or list y Find the estimated value of y for a given value of x by applying the function determined by the regression formula Example Using above data find the estimated value for y given x 80 100 1 Press 80 100 S D 1 2 E 11 x and 12 y will be valid afte...

Page 144: ...raphing in an optimum range since window setting values of the graph plotting screen are automatically set using the list data Time min 2 3 4 5 6 7 8 9 10 10 5 11 11 5 12 12 5 Temperature 38 4 46 4 54 4 62 5 69 6 76 1 82 4 88 6 93 4 94 9 96 5 98 2 99 1 100 C Note When selecting a regression equation from 02 to 10 and calling to screen Rg is automatically added to the equation to indicate a regress...

Page 145: ... store as a list then follow the graphing operation resid cannot be graphed when specified independently 1 Press C S D 0 4 04 x2 2 Press 1 2 z A E A 1 If you enter Y1 as the last variable the obtained formula will automatically be set to the formula Y1 3 Press E The regression formula and parameters will be displayed on the screen 4 Press G The calculator will draw the scatter diagram using the de...

Page 146: ...turn and Goto with Label While programming editing mode is set to one line mode regardless of the SETUP settings 1 Try it Display a message HELLO WORLD on the display 1 Press P The program menu screen will appear A EXEC Executes the selected program B EDIT Opens a stored program file C NEW Creates a new program file 2 Press C E A new program window will open 3 Input the program name HELLO on the t...

Page 147: ...aracter 6 Press P The program menu will open The commands and other state ments are pre installed in the calculator Do not directly type in commands using the Alphabetical mode select each command from the program menu 4 Press E 5 The cursor will move to the program input field just under the title When a line exceeds the width of the screen the display will shift to the left 12 Press E The cursor...

Page 148: ...cute the program 01 HELLO 2 Programming Hints Press P B and then the appropriate numbers to open the stored program Press i to enter the insert type mode Press E to go to the next line Be sure to press i again to turn off the insert type mode and return to type over mode Press E twice to insert a blank line Press A to enter characters Press to use a ALPHA LOCK mode to input a series of alphabetica...

Page 149: ...nce in one program a variable is set as a global variable across all other stored programs unless redefined Hence results calculated in one program can be used by another Only numerical values can be set as variables Strings cannot be set as variables Setting a variable Use R to input a specific value or the value of formula into the variable Do not use comparison operands to set the values into v...

Page 150: ...int Input Wait Rem End and other commands can be used in a program Data input output graph settings and others can be controlled from a program Press P in the program edit mode to input the command A PRGM menu P A 1 Print Print variable Print character strings Displays the value of the variable on the screen The display format may vary according to the SET UP menu settings Character strings displa...

Page 151: ...ecified interruption continues until any key is pressed A symbol will flash at the upper right corner of the screen during the wait This command can be used for displaying intermediate results or other information 5 Rem Rem comments Comments start with Rem and extend to the end of the line These lines are ignored at execution Comments should be entered as notes for future reference though it shoul...

Page 152: ...rG ClrG Clears the graph screen without affecting the specified graph After the graph screen is cleared the specified graph statement is drawn 3 DispT DispT Displays the program text screen 4 DispG DispG Displays the graph screen D I O menu P D This menu is used to send or receive data from externally connected devices 1 Get Get variable Receives data from externally connected devices 2 Send Send ...

Page 153: ...xprON ExprON Sets the graph equation to be displayed on the graph screen 2 ExprOFF ExprOFF Sets the graph equation to not be displayed on the graph screen 3 Y ON Y ON Sets the value of the derived function Y to be displayed on the graph screen 4 Y OFF Y OFF Sets the value of the derived function Y to not be displayed on the graph screen 5 Connect Connect Draws a graph with connected lines 6 Dot Do...

Page 154: ... statistical graphs 5 PlotOFF PlotOFF number Sets drawing of the specified statistical graph to off If no number is specified this command turns off all of the statistical graphs 6 Flow control tools The calculator has the common flow control tools such as Goto Label loop structures with If statement clauses for enhancing a program s efficiency It also has the capabil ity for subroutines To access...

Page 155: ... can be nested 7 Other menus convenient for programming H COPY menu P H You can copy and paste line by line using the COPY menu commands 1 Move the cursor to the line that you wish to copy 2 Press P H 3 Select 1 StoLine and press E The selected line will be stored in the memory 4 Move the cursor to the line where you wish to paste the stored line 5 Press P H select 2 RclLine and press E The stored...

Page 156: ...h screen can be selected from the VARS menu Press z to display the VARS menu shown to the right A EQVARS Specifies the graph equation Y1 to Y9 and Y0 X1T Y1T to X6T Y6T B WINDOW Specifies the functions that set the graph display screen size Xmin Ymax Tstep etc C STOWIN Specifies the stored zoom window setting value Zm_Xmin Zm_Ymax etc D L_DATA Specifies list data L_Data1 to L_Data9 and L_Data0 E G...

Page 157: ...DITOR to one line mode prior to assigning such graphic equations Expression Operational sequence 3 Xmin _ 3 R z B E A 1 E 10 Xmax 10 R z E 2 E 1 Xscl 1 R z E 3 E 5 Ymin _ 5 R z E 4 E 5 Ymax 5 R z E 5 E 1 Yscl 1 R z E 6 E Example Zm_Auto Zm_x2 Zm_sin etc Always enter the argument for functions requiring an argument at the end of the command such as the CALC function k An error will be returned for ...

Page 158: ... 182 5 173 8 166 5 185 3 A one variable calculation was executed based on this data After returning to the calculation screen average values can be viewed by using the following procedure Press z H E A 0 2 to display x _ on the screen Press E to obtain the average value of X as determined in the previous calculation In this way the contents of an immediately preceding statistical calculation can b...

Page 159: ...2 F Print F Print F End Label FTOC Input F 5 9 F 32 C Print C Print C End Execution can be interrupted by pressing O Use this command if the program enters an infinite loop Press or to display the program source with the cursor on the line where interrupted Refer to Appendix Error Codes and Error Messages on page 167 CONVERT Selects conver sion mode Celsius to Fahrenheit Fahrenheit to Celsius When...

Page 160: ... INSCORE 1 I Print ENTER SCORE Input A A L1 1 2 I Label LOOP Print ENTER NEXT Input A A L1 I I 1 I If I 10 Goto LOOP Return Label AVGSCORE Print AVERAGE IS Median L1 M Print M Wait 3 Return Creates a histogram based on the entered data HIST Sequentially input the data in list L1 Calculate the median of List L1 ...

Page 161: ...calculator or PC E Resets the calculator 1 Adjusting the screen contrast 1 Press p The screen contrast setting window will appear 2 Press to darken or to lighten the screen 2 Checking the memory usage The memory usage window enables you to check how much memory you have used If the memory is nearly full delete files or reset the calculator to operate safely 1 Press p 2 Press B The memory check win...

Page 162: ... of memory bytes used by graph pictures G_Data The amount of memory bytes used by stored graph data L_Data The amount of memory bytes used by stored list data Slide The amount of memory bytes used by slide shows the user has created 3 Deleting files Press p C to enter the delete menu The sub menu items are the same as those of the Memory Check menu List Graph Eqn Program Picture G_Data L_Data and ...

Page 163: ... machine 5 The send menu will appear on the display Specify the data to send from the following categories 3 Press E L3 will disappear and the L3 line will become empty Press q to cancel the delete option Above procedures and displays are only an example Displayed items may vary according to data input and use Press p C 8 to delete the memories previously entered 4 Linking to another EL 9450 or PC...

Page 164: ...s 8 Slide Displays a list of all the user made slide show data 9 A Z θ Displays a list of variables A to Z and θ B BACKUP Send all the data stored in the calculator memory 6 Select the item to send using and pressing E A will be placed by the selected item 7 Press h to send 8 Transmission begins and a busy message will appear on the displays of the both calculators An data in the same memory locat...

Page 165: ... RESET option 1 Press p E 2 Press 1 to return the calculator s SETUP and FORMAT settings to the default value or 2 to delete all the stored data See Resetting the Calculator on page 25 for details 3 Press 1 A list of all the data stored will be are displayed and the cursor positioned on the top line You can also select 2 List for L1 and L2 and 3 Graph Eqn for Y2 for example and send the data categ...

Page 166: ... clean water and immediately consult a doctor Should fluid from a leaking battery come into contact with your skin or clothes immediately wash with clean water If the product is not to be used for some time to avoid damage to the unit from leaking batteries remove them and store in a safe place Do not leave exhausted batteries inside the product Do not fit partially used batteries and be sure not ...

Page 167: ...will show indicating that a new set of batteries are needed 1 Turn off the calculator s power o 2 Turn over the calculator Locate the battery compart ment cover and open the cover as illustrated 3 Replace all four AAA batteries as illustrated 4 Replace the battery compartment cover The following message will appear If the message does not appear repeat the procedures from step 2 5 Press O Do not p...

Page 168: ...backup battery cover as shown 3 Use a pen to lift the lithium battery out of the battery compartment 4 Insert the new battery with the PLUS side facing up 5 Replace the lithium battery cover 6 Replace the battery compartment cover The following message will appear 7 Press O Do not press C C C C C This will clear all the data ...

Page 169: ...nnot be seen clearly on the display The screen contrast may need to be adjusted Press p then press A to enter A CTRST the screen contrast can be adjusted by using the or the key The calculator won t take the minus sign calculation results in a syntax error To set a negative value use the _ key instead of the key The calculation results are very different from what is usually expected The angle uni...

Page 170: ...f this does not work then press then O to tell the running application to quit If everything fails then the calculator s memory may need to be reset Resetting the calculator s memory will clear all the stored information such as programs lists and variables To reset the unit s memory press the RESET switch on the back of the unit to open the verification window To prevent data loss try O first If ...

Page 171: ... operation statistic calcula tion regression calculation etc Input method Manual key entry Graphic features Built in slide show shift change rapid graph Rectangular parametric coordinate graph Graph range specification graph window mode automatic specification graph plotting trace calculation function zoom picture input paint graph database register etc Statistic features 1 2 variable statistical ...

Page 172: ...ion 0 13 W Battery life Operation battery set approx 200 hours with 5 minutes of continual use and 55 minutes in the display state for every hour at a temperature of approx 20 C 68 F Memory backup approx 5 years at a temperature of approx 20 C 68 F and when the operation batteries are replaced frequently Note The life span may differ according to battery brand type usage and ambient temperature Ex...

Page 173: ...n X2 X 1 r and g 3 Exponential functions ab a etc 4 Multiplications between a value and a stored variable con stant with abbreviated 2π 2A etc 5 Single calculation functions where the numerical value occurs after the function sin cos tan sin 1 cos 1 tan 1 log 10x ln ex abs int ipart fpart not etc 6 Multiplications between a number and a function in 5 3cos20 etc cos20 is evaluated first 7 Permutati...

Page 174: ... Argument definition outside of domain Increment Increment error found Stat Med Med Med law statistic error found No Argument Argument missing Not pair dx and dx are not used in a pair Not pair Parentheses are not used in a pair Not pair Braces are not used in a pair Line over Line is over the capacity Not delete Unable to delete a selected item Buffer over Input equation exceeds buffer capability...

Page 175: ...ode set Memory over Memory is full cannot store data as requested System error System error found user memory space is insecure Low battery Operation interrupted due to low battery power BREAK Operation break specified Error Code Description Error Message The following operations may cause Editor type error Correct the Editor type to continue Recall the Graph data G_DATA stored in a different EDIT...

Page 176: ...ver a calculation error increases in continuous calculations due to accumulation of each calculation error This is the same for ab b a n ex In etc where continuous calculations are performed internally Additionally a calculation error will accumulate and become larger in the vicinity of inflection points and singular points of functions Function Calculation range Notes sin x cos x tan x sin 1 x co...

Page 177: ...g a b a 10 1 a log b n and r are positive integers x 1 1050 0 x 1 10100 0 5 n 69 5 When a 0 1 10100 b log a 100 When a 0 0 b 1 10100 When a 0 b is an integer or 1 b is an odd number b 0 However 1 10100 b log a 100 When b 0 1 10100 1 a log b 100 a 0 When b 0 0 a 1 10100 When b 0 a is an odd number or 1 a is an integer a 0 However 1 10100 1 a log b 100 0 r n 69 x 1 10100 x 1 10100 y 1 10100 x2 y 2 1...

Page 178: ... σx r x 1 1050 y 1 1050 Σx 1 10100 Σx2 1 10100 Σy 1 10100 Σy2 1 10100 Σxy 1 10100 n 1 10100 n 0 n 1 Σx 1 1050 0 Σx 2 n Σx2 n 1 1 10100 n 0 Σx 1 1050 0 Σx 2 n Σx2 n 1 10100 n 0 Σx 1 1050 Σy 1 1050 0 Σx2 Σx 2 n Σy2 Σy 2 n 1 10100 Σxy ΣxΣy n 1 10100 1 10100 Same for y _ sy and σy ...

Page 179: ...ents exceeds 1000 A number with 10 or less decimal places or the 1010 th or above decimal places are 0 Function Calculation range Notes b a y x n 0 Σx 1 1050 Σx Σy 1 10100 0 Σx2 Σx 2 n 1 10100 Σxy ΣxΣy n 1 10100 1 10100 bx _ 1 10100 y _ bx _ 1 10100 bx 1 10100 a bx 1 10100 y a 1 10100 y a b 1 10100 Regression calcula tions excluding 2nd degree polynomials Same as above Same as b for other ...

Page 180: ... dx A 6 43 dx equation lower limit upper limit the number of divisions dx A 7 43 M M M M NUM abs abs value B 1 44 round round value digit number of decimals B 2 44 ipart ipart value B 3 44 fpart fpart value B 4 45 int int value B 5 45 min min value A value B or min list B 6 45 max max value A value B or max list B 7 45 lcm lcm natural number natural number B 8 46 gcd gcd natural number natural num...

Page 181: ...1 51 value A value B F 2 51 value A value B F 3 51 value A value B F 4 51 value A value B F 5 51 value A value B F 6 51 M M M M LOGIC and value A and value B G 1 52 or value A or value B G 2 52 not not value G 3 52 xor value A xor value B G 4 53 xnor value A xnor value B G 5 53 Functions Commands Syntax Keystrokes Page l l l l OPE sortA sortA list name subordinate list name1 subordinate list name ...

Page 182: ...t B 7 116 varian varian list frequency list B 8 116 l l l l L_DATA StoLD StoLD natural number C 1 117 RclLD RclLD natural number C 2 118 Functions Commands Syntax Keystrokes Page S S S S EDIT OPE EDIT No arguments A E 124 sortA sortA list subordinate list 1 subordinate list n B 1 133 sortD sortD list subordinate list 1 subordinate list n B 2 133 SetList SetList list name 1 list name 2 list name 3 ...

Page 183: ...to store D 0 6 135 abx Rg_abx list name for x list name for y frequency list equation name to store D 0 7 135 aebx Rg_aebx list name for x list name for y frequency list equation name to store D 0 8 135 x 1 Rg_x 1 list name for x list name for y frequency list equation name to store D 0 9 135 axb Rg_axb list name for x list name for y frequency list equation name to store D 1 0 135 x value or list...

Page 184: ... No arguments E 1 129 MBox No arguments E 2 129 MBox No arguments E 3 129 MBox No arguments E 4 129 Pie No arguments F 1 130 Pie No arguments F 2 130 Scattr No arguments G 1 130 Scattr No arguments G 2 130 Scattr No arguments G 3 130 xyLine No arguments H 1 130 xyLine No arguments H 2 130 xyLine No arguments H 3 130 Functions Commands Syntax Keystrokes Page d d d d DRAW ClrDraw No arguments A 1 66...

Page 185: ...y coordinate B 3 74 PxlON PxlON column row B 4 74 PxlOFF PxlOFF column row B 5 74 PxlCHG PxlCHG column row B 6 74 PxlTST PxlTST column row B 7 75 d d d d ON OFF LINE G_DATA PICT SHADE DrawON DrawON equation number 1 equation number 2 C 1 75 DrawOFF DrawOFF equation number 1 equation number 2 C 2 75 LINE No arguments D E 76 StoGD StoGD number E 1 76 RclGD RclGD number E 2 76 StoPict StoPict number ...

Page 186: ... Z Z EXP 10x No arguments D 1 60 ex No arguments D 2 60 log x No arguments D 3 60 ln x No arguments D 4 60 Z Z Z Z TRIG sin x No arguments E 1 60 cos x No arguments E 2 60 tan x No arguments E 3 60 sin 1 x No arguments E 4 60 cos 1 x No arguments E 5 60 tan 1 x No arguments E 6 61 Z Z Z Z STO RCL StoWin No arguments F 1 61 RclWin No arguments G 1 61 PreWin No arguments G 2 61 Functions Commands Sy...

Page 187: ...guments A 2 92 Y No arguments A 3 92 Y 1 x No arguments A 4 92 Y sin x No arguments A 5 92 Y tan x No arguments A 6 92 Y cos 1 x No arguments A 7 92 Y In x No arguments A 8 92 ORG NEW EDIT ORG No arguments B E 94 NEW No arguments C E 94 MOVE No arguments D 1 95 DEL No arguments D 2 95 RENAME No arguments D 3 95 Functions Commands Syntax Keystrokes Page SHIFT Y x2 No arguments A 1 99 Y No arguments...

Page 188: ... No arguments B 6 104 Functions Commands Syntax Keystrokes Page FRAC Simp Simp number 1 40 a b c value a b c 2 41 b c value b c 3 41 A xxx value A xxx 4 41 Functions Commands Syntax Keystrokes Page P P P P EXEC No arguments A 139 EDIT No arguments B 139 NEW No arguments C E 139 P P P P in the Prgramming mode PRGM Print Print variable Print character strings A 1 143 characters A 2 143 Input Input v...

Page 189: ...e D 1 145 Send Send variable D 2 145 P P P P in the Prgramming mode COORD Rect No arguments E 1 146 Param No arguments E 2 146 P P P P in the Prgramming mode FORM ExprON No arguments F 1 146 ExprOFF No arguments F 2 146 Y ON No arguments F 3 146 Y OFF No arguments F 4 146 Connect No arguments F 5 146 Dot No arguments F 6 146 Sequen No arguments F 7 146 Simul No arguments F 8 146 P P P P in the Prg...

Page 190: ... Appendix PlotON PlotON number G 4 147 PlotOFF PlotOFF number G 5 147 P P P P in the Prgramming mode COPY StoLine No arguments H 1 148 RclLine No arguments H 2 148 Functions Commands Syntax Keystrokes Page ...

Page 191: ...x ZOOM 58 Braces 37 BRNCH menu Programming 145 147 Broken line plot Graph type 128 BS key 6 Built in slide show 92 C CALC 42 64 CALC key 5 CALC menu STAT 125 CALC MATH 42 Calculation range 169 Calculation screen entering the 11 Calculation screen returning to the 6 CHANGE feature 96 104 Circle DRAW 72 CL key 6 CLIP key 6 ClrDraw DRAW 66 ClrG SCRN 145 ClrList OPE 133 ClrT SCRN 145 Colon 110 Combina...

Page 192: ...60 EDIT SLIDE SHOW 89 95 Editing mode 14 Editing the original slide show 95 EDITOR 23 End PRGM 144 Eng FSE 22 ENTER key 6 30 ENTRY key 38 Eqn EDITOR 23 Equation mode EDITOR 14 23 Equality 51 EQVARS VARS 149 Error codes 167 Error messages 24 167 EXP ZOOM 60 Exponent 34 36 EXPRES FORMAT 79 ExprOFF FORM 146 ExprON FORM 146 EZ key 6 83 86 88 F FACTOR ZOOM 59 Factorial PROB 47 fill OPE 112 Fix FSE 22 F...

Page 193: ...er EL 9450 or PC 156 List features 107 LIST key 6 List creating a 109 List drawing multiple graphs 116 List normal operations 109 List special operations 111 List Table 118 ln 33 ln REG 134 ln X EXP 60 log 33 log REG 135 log2 CALC 42 Logarithm keys 7 33 log X EXP 60 LOGIC MATH 51 M Manual SIMPLE 24 Math calculation 12 Math function keys 18 MATH menu 42 MATH menu key 6 20 MATH menu List 114 max MAT...

Page 194: ...e of calculation 166 PreWin RCL 61 PRGM menu key 6 20 PRGM menu programming 143 Print PRGM 143 PROB MATH 46 Probability 46 prod MATH 115 Program blank line 141 Program changing a name 142 Program copying 142 Program creating a 139 Program debugging 151 Program deleting a line 141 Program entering a command 140 Program entering an alphabet 140 Program executing the 141 Program operand 143 Program s...

Page 195: ...154 SCRN menu programming 145 Second angle 50 SELECT menu LINK 157 Send I O 145 seq OPE 113 Sequen FORM 146 Sequen STYLE2 79 SET SHADE 78 SetList OPE 133 SETUP key 6 21 SETUP menu 22 57 Sexagesimal 48 Shade DRAW 71 SHADE DRAW 78 SHIFT feature 96 99 SHIFT CHANGE key 6 96 Simp 40 SIMPLE SETUP 24 Simul FORM 146 Simul STYLE2 79 sin 32 sin X TRIG 60 sin 1 35 sin 1 X TRIG 60 SLIDE SHOW 89 SLIDE SHOW key...

Page 196: ...tric keys 7 32 35 Trouble shooting 162 U User TABLE 82 V V_line DRAW 69 Value CALC 64 Variable programming 142 Variable store 34 varian MATH 116 Variance 116 VARS key 6 35 VARS menu programming 149 Viewing the original slide show 94 W Wait PRGM 144 WINDOW 62 WINDOW key 5 Window setting a 63 123 WINDOW VARS 149 X x2 REG 134 X_Incpt CALC 65 x 1 REG 135 X 1 POWER 60 X2 POWER 60 x REG 136 xnor LOGIC 5...

Page 197: ......

Page 198: ...lla direttiva 89 336 EEC come emendata dalla direttiva 93 68 EEC ÂÁÎ Ù ÛÙ ÛË Ù ÓÙ ÔÎÚ ÓÂÙ È ÛÙÈ ÈÙ ÛÂÈ ÙˆÓ Ô ËÁÈÒÓ ÙË Úˆ Î ÓˆÛË 89 336 fi ˆ Ô Î ÓÔÓÈÛÌfi Ùfi Û Ì ÏËÚÒıËÎÂ fi ÙËÓ Ô ËÁ 93 68 Este equipamento obedece às exigências da directiva 89 336 CEE na sua versão corrigida pela directiva 93 68 CEE Este aparato satisface las exigencias de la Directiva 89 336 CEE modificada por medio de la 93 68 CEE De...

Page 199: ...SHARP CORPORATION 02EGK TINSE0465THZZ PRINTED IN CHINA IMPRIMÉ EN CHINE IMPRESO EN CHINA ...

Page 200: ... tv dvd and othes Manual users user manuals user guide manual owners manual instruction manual manual owner manual owner s manual guide manual operation operating manual user s manual operating instructions manual operators manual operator manual product documentation manual user maintenance brochure user reference pdf manual Downloaded from http www usersmanualguide com ...

Reviews: