127
Chapter 8: Statistics & Regression Calculations
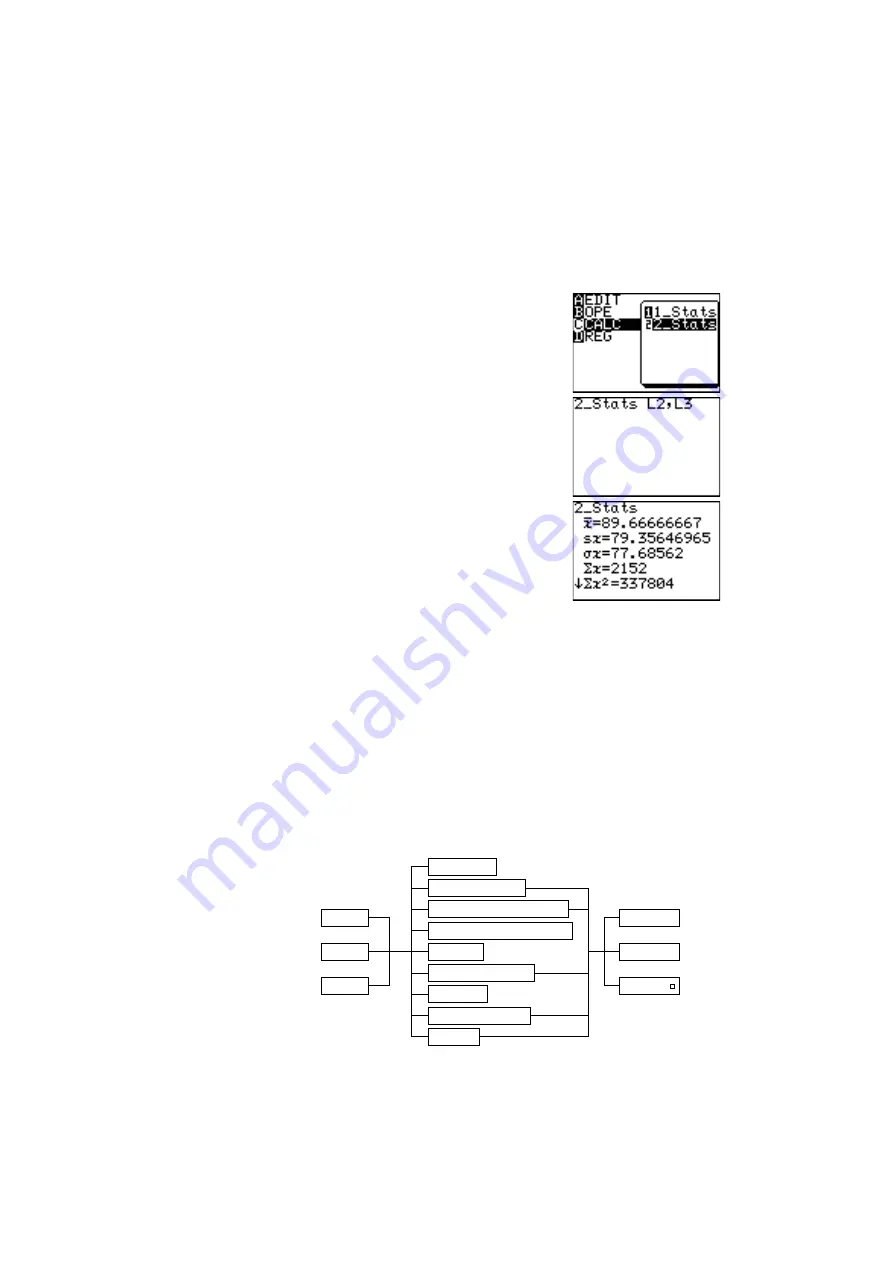
Calculating the previous two-variable statistical values can be
performed in a single operation. Use a “ , ” (comma) to separate
the two variables.
1. Press
#
C
and
S
to
display the statistics menu.
2. Press
C
and then
2
.
2_Stats
will be displayed on the top
line of the screen followed by the
cursor.
3. Press
@
2
,
@
3
to enter L2 and L3, and
press
E
.
All the statistical values will be
displayed on the screen.
4. Press
}
or
{
to scroll the
screen.
PLOT1
PLOT2
PLOT3
POINT: •
POINT: +
POINT:
Histogram
Broken line plot
Normal probability plot
Normal distribution plot
Box plot
Modified box plot
Pie chart
Scatter diagram
XY line
3. Graphing the statistical data
Press
@
[
to access the statistical graphing mode.
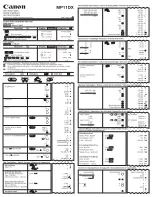
The calculator can plot statistical data on up to 3 types of graph
(PLOT1 to PLOT3) to check the state of distribution.
The graph types can be selected from histogram, broken line plot,
normal probability plot, normal distribution plot, box plot, modified
box plot, pie chart, scatter diagram and XY line. Broken line plot,
normal probability plot, modified box plot, scatter diagram and XY
line can use 3 different types of points.
Statistical graph types overview (chart)


