90
CHAPTER 4
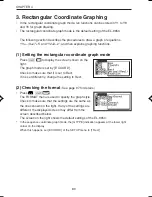
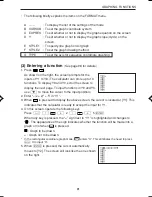
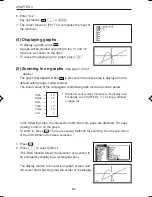
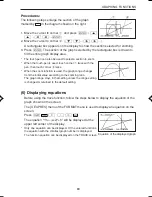
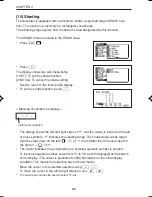
(11) Displaying tables
(See page 121 for details.)
• A table is a chart of values yielded by a function (Yn)
for values of X.
• There are two methods to create tables. In one
method, the entry of a function automatically produces
a table. In the other method, values are manually
entered for X.
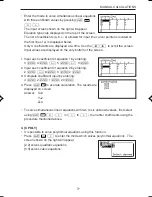
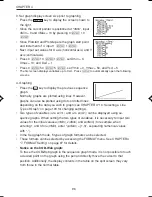
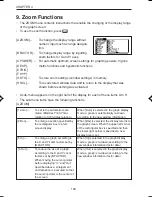
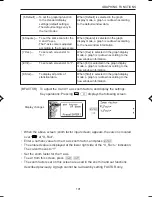
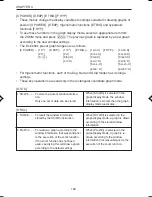
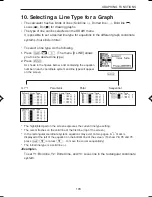
• To produce a table, it is necessary to display the TABLE SET screen.
The TABLE SET screen is used to enter information necessary for a table display,
such as whether to use the automatic table function or to manually input values, and
the start value and table step.
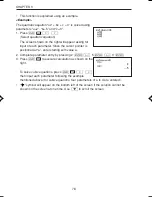
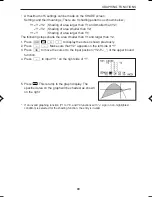
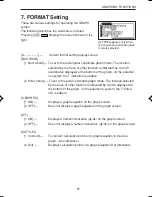
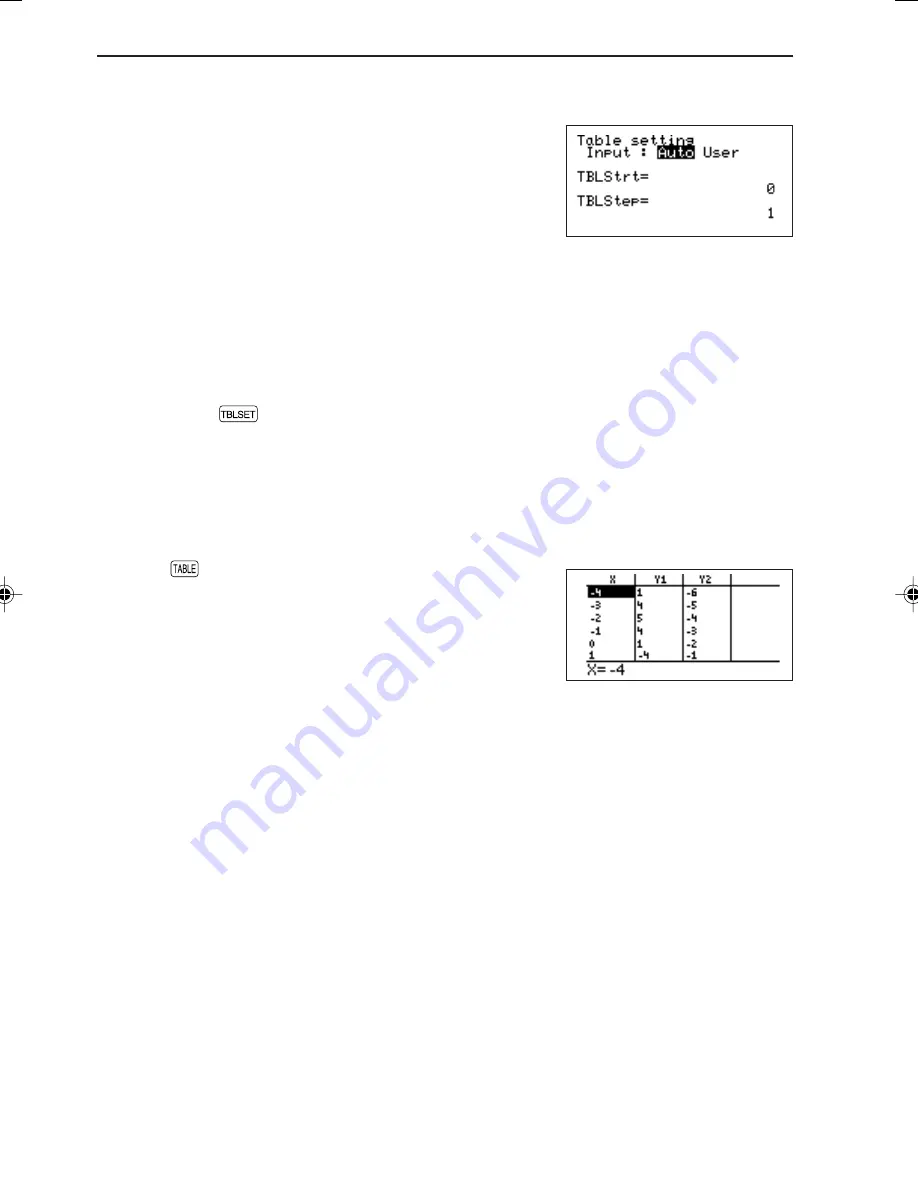
1. Press
Ï
≥
.
Specifies the automatic table production mode.
2. Press
—
4
®
.
Sets “-4” in Table Start.
3. Press 1
®
.
Sets “1” in Table Step.
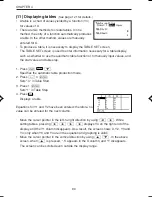
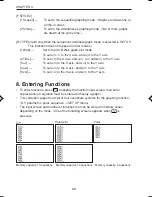
4. Press
.
Displays a table.
Equations for Y1 and Y2 have been entered; therefore, no
value can be entered for the next column.
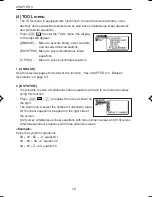
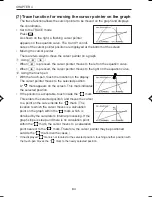
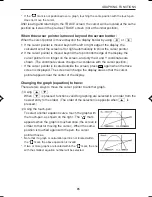
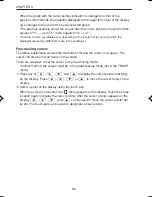
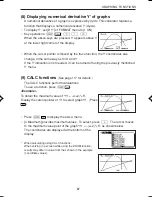
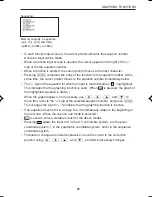
• Move the cursor pointer in the left-to-right direction by using
<
>
. While
setting tables, pressing
>
>
>
>
displays Y4 on the right end of the
display, and the Y1 column disappears. As a result, the screen shows X, Y2, Y3 and
Y4 (only when Y3 and Y4 are in the equation and graphing is valid).
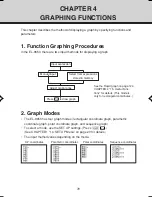
• Move the cursor pointer in the vertical direction by using
≤
≥
. In the above
screen, when
≤
is pressed, “-5” appears in the X column, and “1” disappears.
The screen can be scrolled even outside the display range.
EL-9650-(04)En (079-134)
8/7/00, 9:07 PM
90
Summary of Contents for EL-9650
Page 10: ...viii ...
Page 46: ...36 CHAPTER 1 ...
Page 230: ...220 CHAPTER 9 ...
Page 268: ...258 CHAPTER 12 ...
Page 349: ...339 APPENDIX When coordinate system is Rect param or polar ...
Page 350: ...340 APPENDIX When coordinate system is Seq F STYLE2 E STYLE1 ...
Page 352: ...342 APPENDIX ...
Page 353: ...343 APPENDIX on Program screen ...
Page 354: ...344 APPENDIX ...
Page 355: ...345 APPENDIX ...
Page 356: ...346 APPENDIX ...
Page 357: ...347 APPENDIX ...
Page 358: ...348 APPENDIX ...

