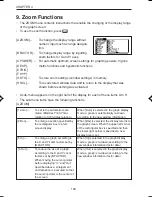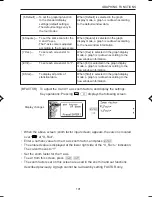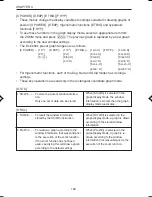
93
GRAPHING FUNCTIONS
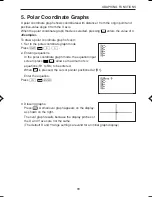
5. Polar Coordinate Graphs
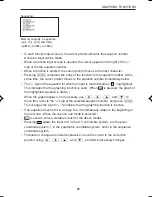
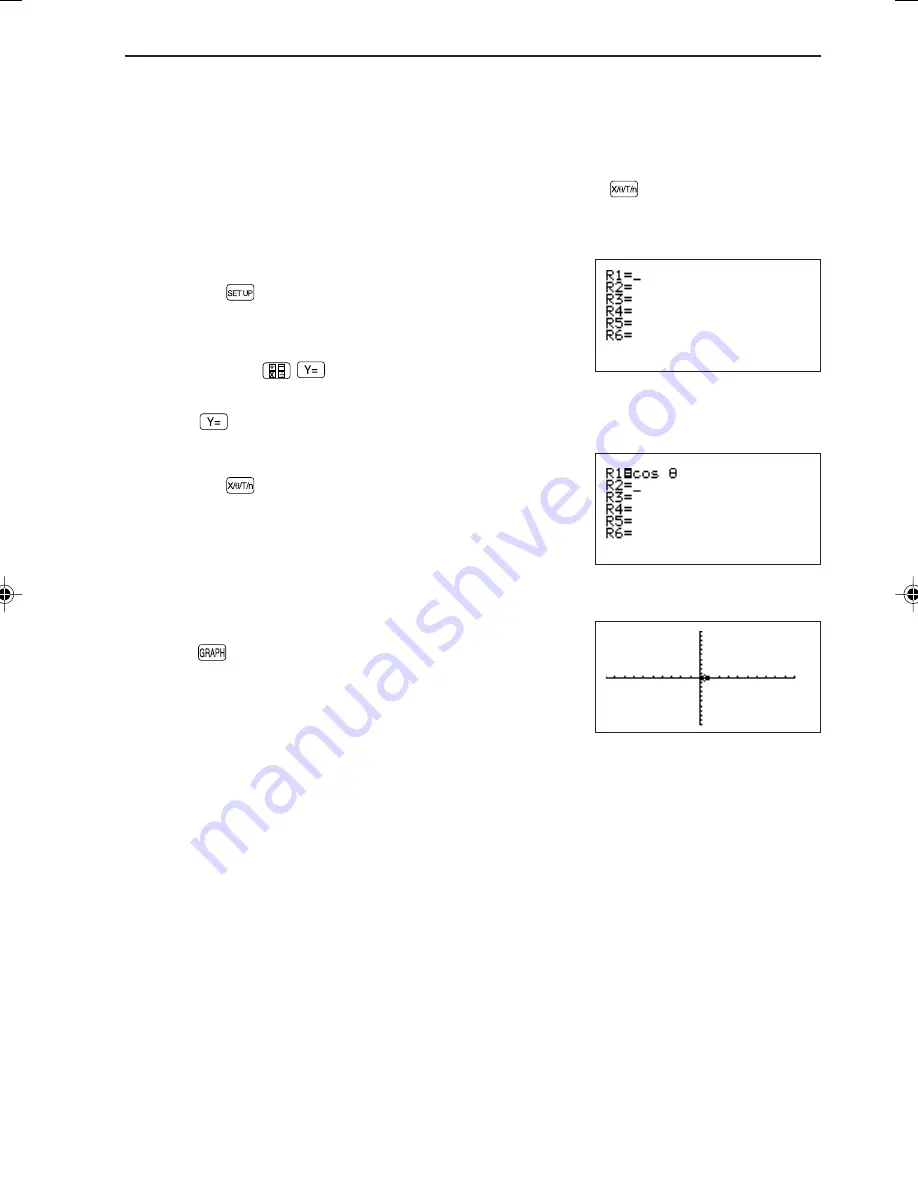
A polar coordinate graph shows coordinates with distance r from the origin point and
positive-value angle
θ
from the X axis.
When the polar coordinate graph mode is selected, pressing
enters the value of
θ
.
<Example>
To draw a polar coordinate graph of cos
θ
:
1. Set to the polar coordinate graph mode
Press
Ï
E
3
.
2. Entering equations.
In the polar coordinate graph mode, the equation input
screen (press
) allows a maximum of six
equations (R1 to R6) to be entered.
When
is pressed, the cursor pointer positioned at [R1].
Enter the equation.
Press
c
®
.
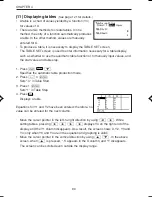
3. Drawing graphs.
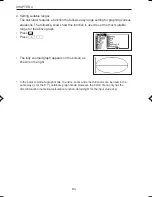
Press
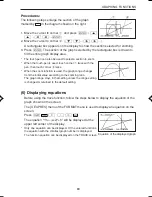
. A small oval graph appears on the display,
as shown on the right.
The oval graph results because the display pitches of
the X and Y axes are not the same.
(The default X and Y range settings are valid for an initial graph display.)
EL-9650-(04)En (079-134)
8/7/00, 9:07 PM
93
Summary of Contents for EL-9650
Page 10: ...viii ...
Page 46: ...36 CHAPTER 1 ...
Page 230: ...220 CHAPTER 9 ...
Page 268: ...258 CHAPTER 12 ...
Page 349: ...339 APPENDIX When coordinate system is Rect param or polar ...
Page 350: ...340 APPENDIX When coordinate system is Seq F STYLE2 E STYLE1 ...
Page 352: ...342 APPENDIX ...
Page 353: ...343 APPENDIX on Program screen ...
Page 354: ...344 APPENDIX ...
Page 355: ...345 APPENDIX ...
Page 356: ...346 APPENDIX ...
Page 357: ...347 APPENDIX ...
Page 358: ...348 APPENDIX ...

