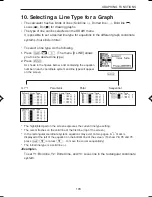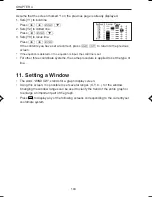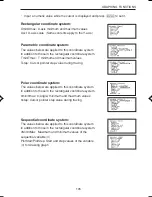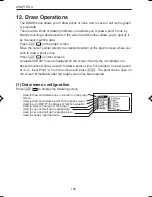
97
GRAPHING FUNCTIONS
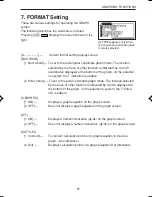
7. FORMAT Setting
These are various settings for operating the GRAPH
screen.
The following describes the sub-menus in detail.
Pressing
Ï
displays the screen shown on the
right.
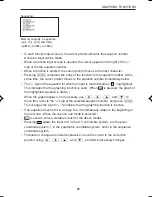
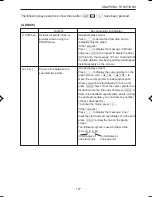
[A – – – – – –] —
Current format setting display screen.
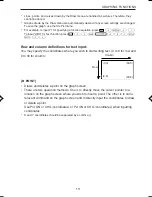
[B CURSOR]
[1 Rect Coord] — To set to the rectangular coordinate graph mode. The location
selected by the trace or other function is indicated by X and Y
coordinates displayed at the bottom of the graph. (In the paramet-
ric system, the T indication is added.)
[2 Polar Coord] — To set to the polar coordinate graph mode. The location selected
by the trace or other function is indicated by r and
θ
displayed at
the bottom of the graph. (In the parametric system, the T indica-
tion is added.)
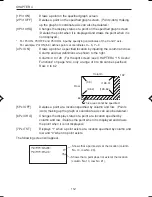
[C EXPRES]
[1 ON] —
Displays a graph equation on the graph screen.
[2 OFF] —
Does not display a graph equation on the graph screen.
[D Y’]
[1 ON] —
Displays a numeric derivative (dy/dx) on the graph screen.
[2 OFF] —
Does not display a numeric derivative (dy/dx) on the graph screen.
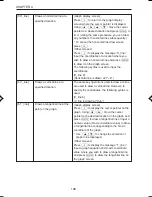
[E STYLE1]
[1 Connect]—
To connect calculation points of a graph equation to create a
graph. (Line indication).
[2 Dot] —
Displays calculation points of a graph equation (Dot indication).
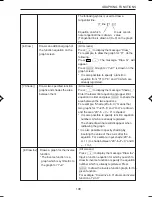
[G TYPE] appears only when
the sequence coordinate graph
mode is selected.
EL-9650-(04)En (079-134)
8/7/00, 9:08 PM
97
Summary of Contents for EL-9650
Page 10: ...viii ...
Page 46: ...36 CHAPTER 1 ...
Page 230: ...220 CHAPTER 9 ...
Page 268: ...258 CHAPTER 12 ...
Page 349: ...339 APPENDIX When coordinate system is Rect param or polar ...
Page 350: ...340 APPENDIX When coordinate system is Seq F STYLE2 E STYLE1 ...
Page 352: ...342 APPENDIX ...
Page 353: ...343 APPENDIX on Program screen ...
Page 354: ...344 APPENDIX ...
Page 355: ...345 APPENDIX ...
Page 356: ...346 APPENDIX ...
Page 357: ...347 APPENDIX ...
Page 358: ...348 APPENDIX ...

