148
CHAPTER 6
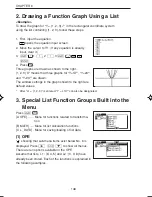
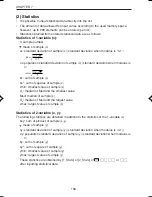
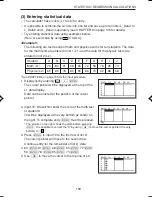
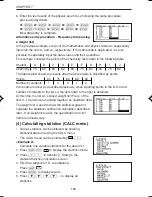
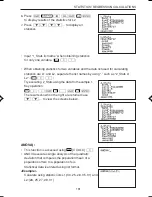
2. Drawing a Function Graph Using a List
<Example>
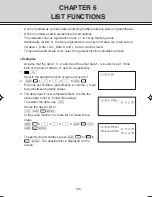
To draw the graph for “Y = {1, 2, 3}
x
2
” in the rectangular coordinate system
using the list containing {1, 2, 3}, follow these steps.
1. First, input the equation.
opens the equation input screen.
2. Move the cursor to Y1. (If any equation is already
input, clear it.)
3.
Ï
1
,
2
,
3
Ï
®
4. Press
.
Three graphs are drawn as shown to the right.
{1, 2, 3} X
2
means that three graphs for “Y=1X
2
”, “Y=2X
2
”,
and “Y=3X
2
” are drawn.
The window settings in the graph shown to the right are
default values.
*
After “L1 = {1, 2, 3}” is entered, “Y = L1X
2
” can also be designated.
3. Special List Function Groups Built into the
Menu
Press
Ï
.
[A OPE] ....... Menu for functions related to transforma-
tion
[B MATH] ..... Menu for list calculation functions
[C L_DATA] . Menu for saving/loading of list data
(1) OPE
“ ” showing that sub-menu items exist below No. 6 is
displayed. Press
>
Å
≥
to show all menus.
There are ten options available in the OPE.
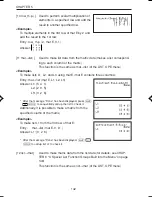
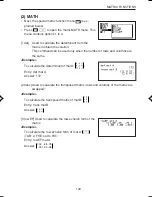
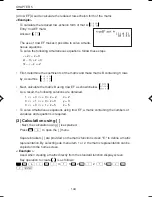
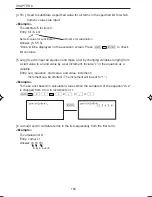
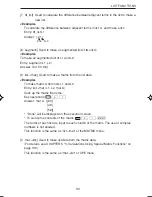
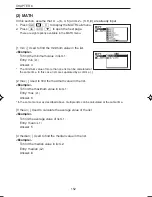
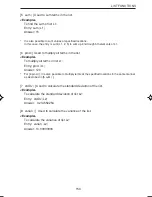
Assume that lists, L1 : {6, 4, 5} and L2 : {3, 9, 8} have
already been stored. Each of the functions is explained in
the following examples.
,
,
EL-9650-(06)EN (145-156)
8/1/00, 9:03 AM
148
Summary of Contents for EL-9650
Page 10: ...viii ...
Page 46: ...36 CHAPTER 1 ...
Page 230: ...220 CHAPTER 9 ...
Page 268: ...258 CHAPTER 12 ...
Page 349: ...339 APPENDIX When coordinate system is Rect param or polar ...
Page 350: ...340 APPENDIX When coordinate system is Seq F STYLE2 E STYLE1 ...
Page 352: ...342 APPENDIX ...
Page 353: ...343 APPENDIX on Program screen ...
Page 354: ...344 APPENDIX ...
Page 355: ...345 APPENDIX ...
Page 356: ...346 APPENDIX ...
Page 357: ...347 APPENDIX ...
Page 358: ...348 APPENDIX ...

