164
CHAPTER 7
for US
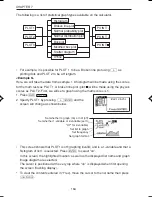
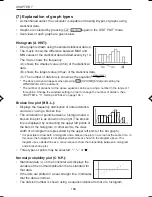
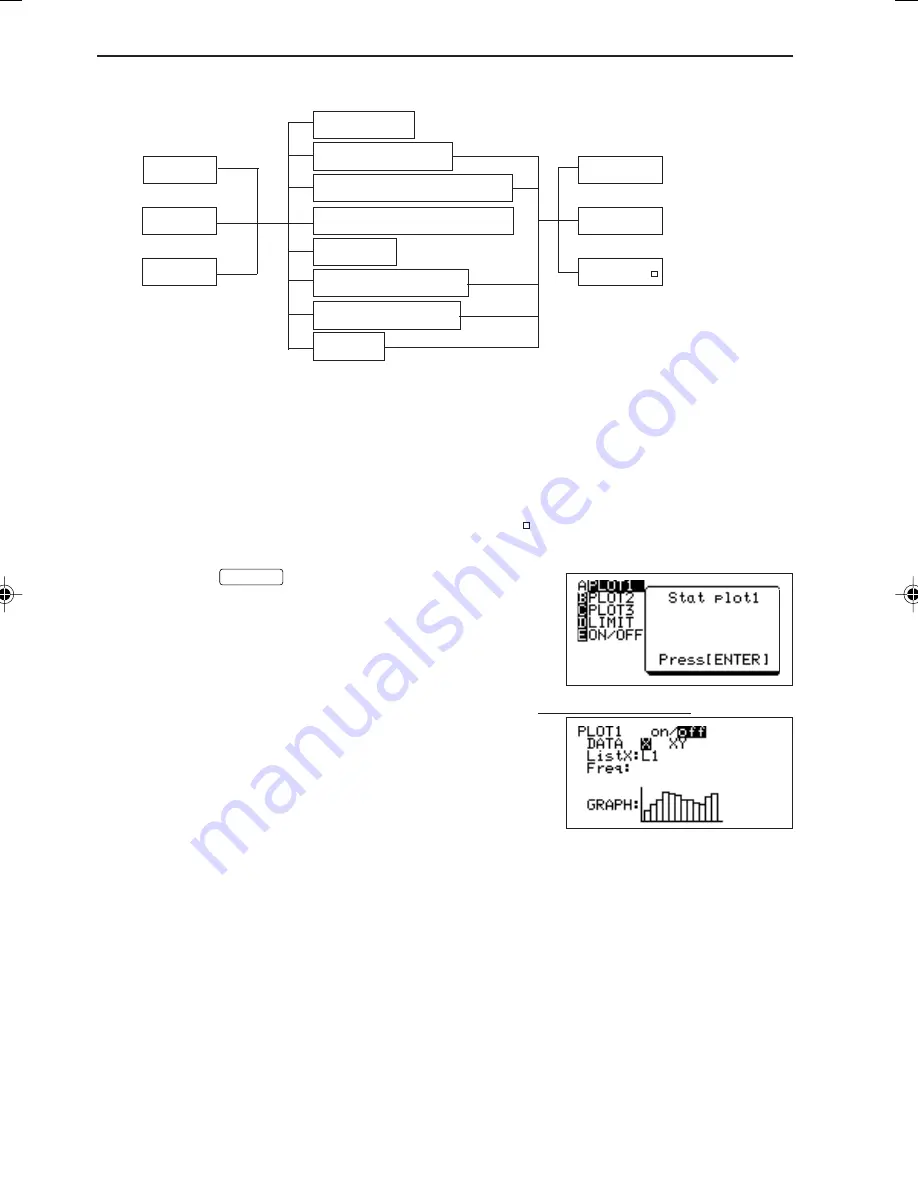
The following is a list of statistical graph types available on the calculator.
Histogram
Broken line plot
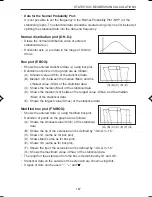
Normal probability plot
Normal distribution plot
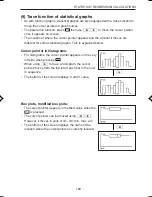
Box plot
Modified box plot
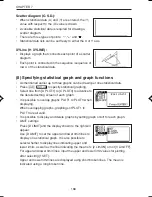
Scatter diagram
XYline
• For example, it is possible for PLOT 1 to be a Broken line plot using
+
as
plotting dots and PLOT 2 to be a Histgram.
<Example 5>
Here, we will take the data from example 1. A histogram will be made using the scores
for the math tests as PLOT 1. A broken line plot (plot: ) will be made using the physics
scores as PLOT 2. First, we will set a graph using the math scores (L1).
1. Press
Ï
STATPLOT
.
2. Specify PLOT1 by pressing
A®
and the
screen will change as shown below.
PLOT1
PLOT2
PLOT3
POINT: °
POINT:
+
POINT:
Set whether to graph (on) or not (off)
Set whether 1-variable or 2-variable (set to
“XY” for 2-variable)
Set list to graph
Set frequency
Set graph format
• This screen shows that PLOT1 is off (graphing invalid) and is a 1-variable and that a
histogram of list 1 is selected. Press
®
to select “on”.
• In this screen, the highlighted location, as well as the displayed list name and graph
image diagram are selected.
• The cursor is positioned at the very top where “on” is displayed when first opening
the screen (flashing display).
* To clear the contents entered in “Freq”, move the cursor to the list name then press
d®
.
→
→
→
→
↓
EL-9650-(07)En (157-177)
8/1/00, 9:06 AM
164
Summary of Contents for EL-9650
Page 10: ...viii ...
Page 46: ...36 CHAPTER 1 ...
Page 230: ...220 CHAPTER 9 ...
Page 268: ...258 CHAPTER 12 ...
Page 349: ...339 APPENDIX When coordinate system is Rect param or polar ...
Page 350: ...340 APPENDIX When coordinate system is Seq F STYLE2 E STYLE1 ...
Page 352: ...342 APPENDIX ...
Page 353: ...343 APPENDIX on Program screen ...
Page 354: ...344 APPENDIX ...
Page 355: ...345 APPENDIX ...
Page 356: ...346 APPENDIX ...
Page 357: ...347 APPENDIX ...
Page 358: ...348 APPENDIX ...

