232
CHAPTER 11
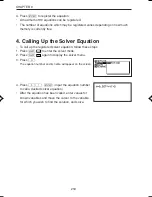
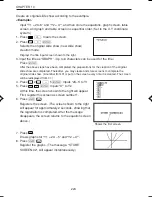
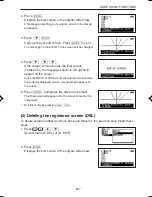
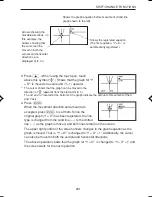
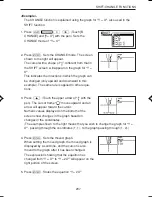
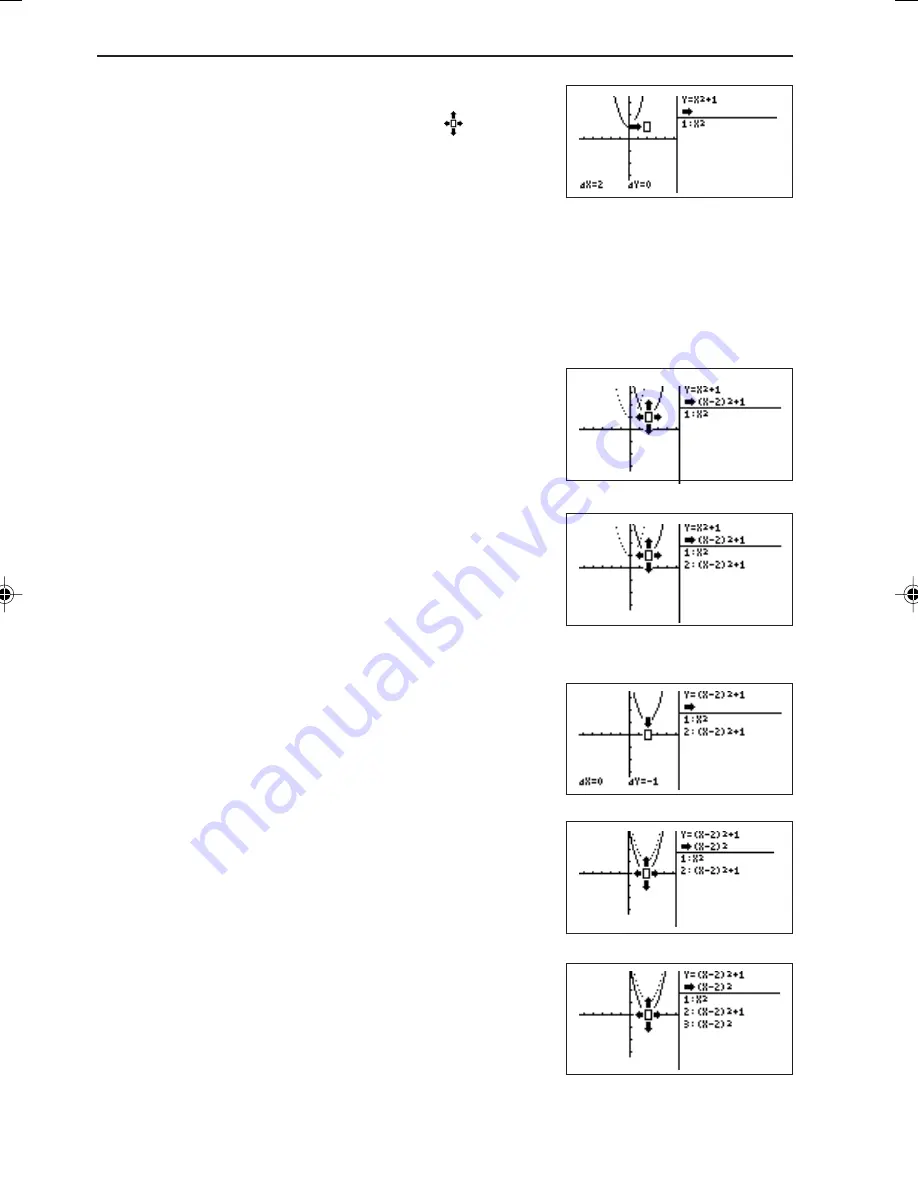
6. Press
®
. The screen shows that the equation is
changed from “Y = X
2
+ 1” to “Y = (X–2)
2
+ 1” as the
graph is moved.
(At the same time, the graph for “Y=X
2
+ 1” is
changed from the solid line to the dotted line.)
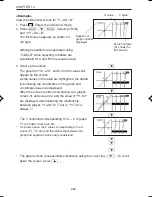
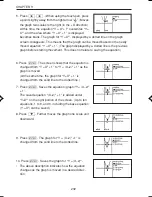
5. Press
>
>
. (When using the touch-pen, press
a point slightly away from the right arrow “
”.) Moves
the graph two scales to the right (in the + X direction).
At this time, the equation “Y = X
2
+ 1” overwrites “Y =
X
2
”, and the area where “Y = X
2
+ 1” is displayed
becomes blank. The graph for “Y = X
2
”, displayed by a dotted line on the graph
screen, disappears. This means that the graph can be moved based on the newly
moved equation “Y = X
2
+ 1”. (The graph displayed by a dotted line is the previous
graph before starting movement. This does not relate to saving the equation.)
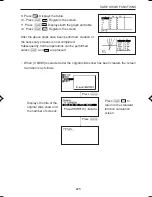
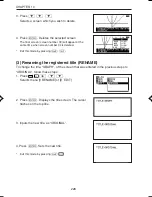
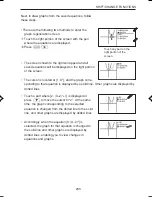
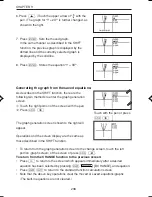
7. Press
®
. Saves the equation (graph) “Y= (X–2)
2
+ 1”.
The saved equation “(X–2)
2
+ 1” is added under
“Y=X
2
” on the right portion of the screen. (Up to ten
equations, 1 to 9, and 0, including the base equation
(Y = X
2
) can be saved.)
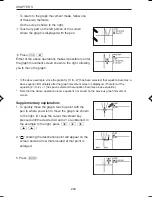
8. Press
≥
. Further moves the graph one scale unit
downward.
9. Press
®
. The graph for “Y = (X–2)
2
+1” is
changed from the solid line to the dotted line.
10. Press
®
. Saves the graph for “Y = (X–2)
2
”.
• The above description indicates how the equation
changes as the graph is moved in a desired direc-
tion.
EL-9650-(11)En (229-238)
8/1/00, 9:29 AM
232
Summary of Contents for EL-9650
Page 10: ...viii ...
Page 46: ...36 CHAPTER 1 ...
Page 230: ...220 CHAPTER 9 ...
Page 268: ...258 CHAPTER 12 ...
Page 349: ...339 APPENDIX When coordinate system is Rect param or polar ...
Page 350: ...340 APPENDIX When coordinate system is Seq F STYLE2 E STYLE1 ...
Page 352: ...342 APPENDIX ...
Page 353: ...343 APPENDIX on Program screen ...
Page 354: ...344 APPENDIX ...
Page 355: ...345 APPENDIX ...
Page 356: ...346 APPENDIX ...
Page 357: ...347 APPENDIX ...
Page 358: ...348 APPENDIX ...

