250
CHAPTER 12
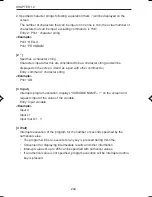
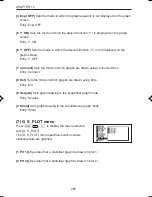
[4 Expr OFF]
Sets the mode in which the graph equation is not displayed on the graph
screen.
Entry: Expr OFF
[5 Y’ ON]
Sets the mode in which the derived function (Y’) is displayed on the graph
screen.
Entry: Y’ ON
[6 Y’ OFF]
Sets the mode in which the derived function (Y’) is not displayed on the
graph screen.
Entry: Y’ OFF
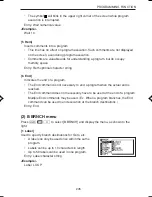
[7 Connect]
Sets the mode in which graphs are drawn using connected lines.
Entry: Connect
[8 Dot]
Sets the mode in which graphs are drawn using dots.
Entry: Dot
[9 Sequen]
Sets graph drawing to the sequential graph mode.
Entry: Sequen
[0 Simul]
Sets graph drawing to the simultaneous graph mode.
Entry: Simul
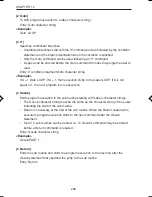
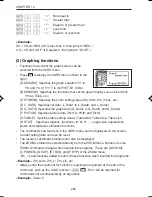
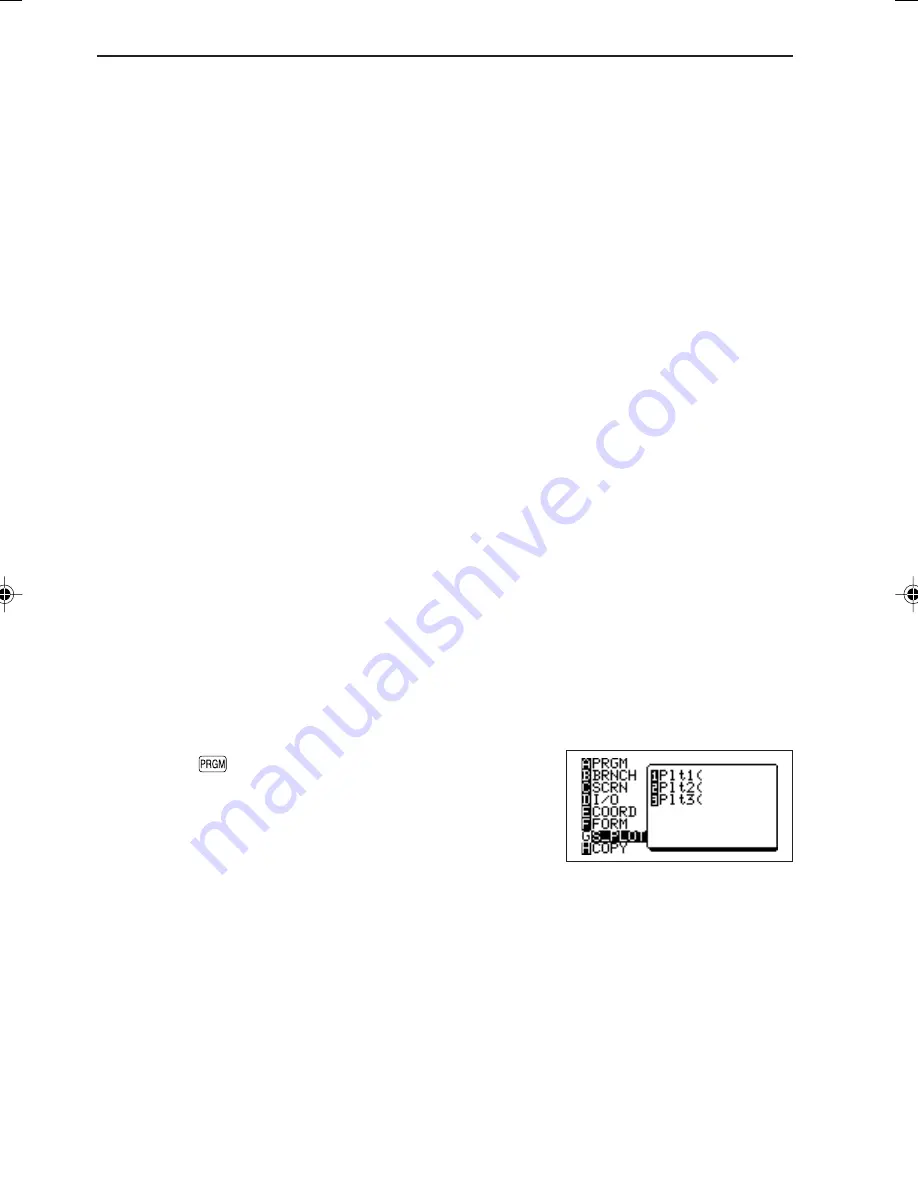
(7) G S_PLOT menu
Press
Ï
G
to display the menu selected
with [G S_PLOT].
The [G S_PLOT] menu specifies locations where
statistical data are graphed.
[1 Plt 1(]
(Specifies that a statistical graph be drawn in plot 1.)
[2 Plt 2(]
(Specifies that a statistical graph be drawn in plot 2.)
EL-9650-(12)En (239-258)
8/1/00, 9:31 AM
250
Summary of Contents for EL-9650
Page 10: ...viii ...
Page 46: ...36 CHAPTER 1 ...
Page 230: ...220 CHAPTER 9 ...
Page 268: ...258 CHAPTER 12 ...
Page 349: ...339 APPENDIX When coordinate system is Rect param or polar ...
Page 350: ...340 APPENDIX When coordinate system is Seq F STYLE2 E STYLE1 ...
Page 352: ...342 APPENDIX ...
Page 353: ...343 APPENDIX on Program screen ...
Page 354: ...344 APPENDIX ...
Page 355: ...345 APPENDIX ...
Page 356: ...346 APPENDIX ...
Page 357: ...347 APPENDIX ...
Page 358: ...348 APPENDIX ...

