333
APPENDIX
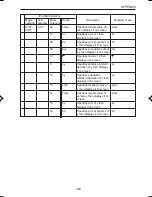
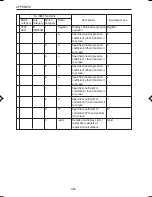
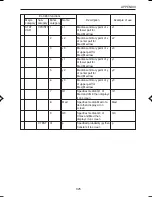
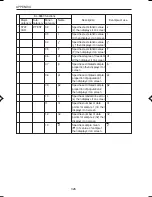
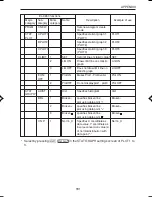
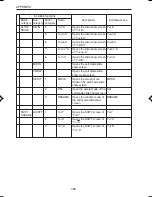
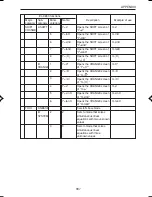
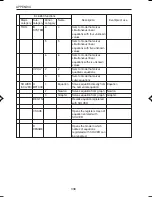
EL-9650 functions
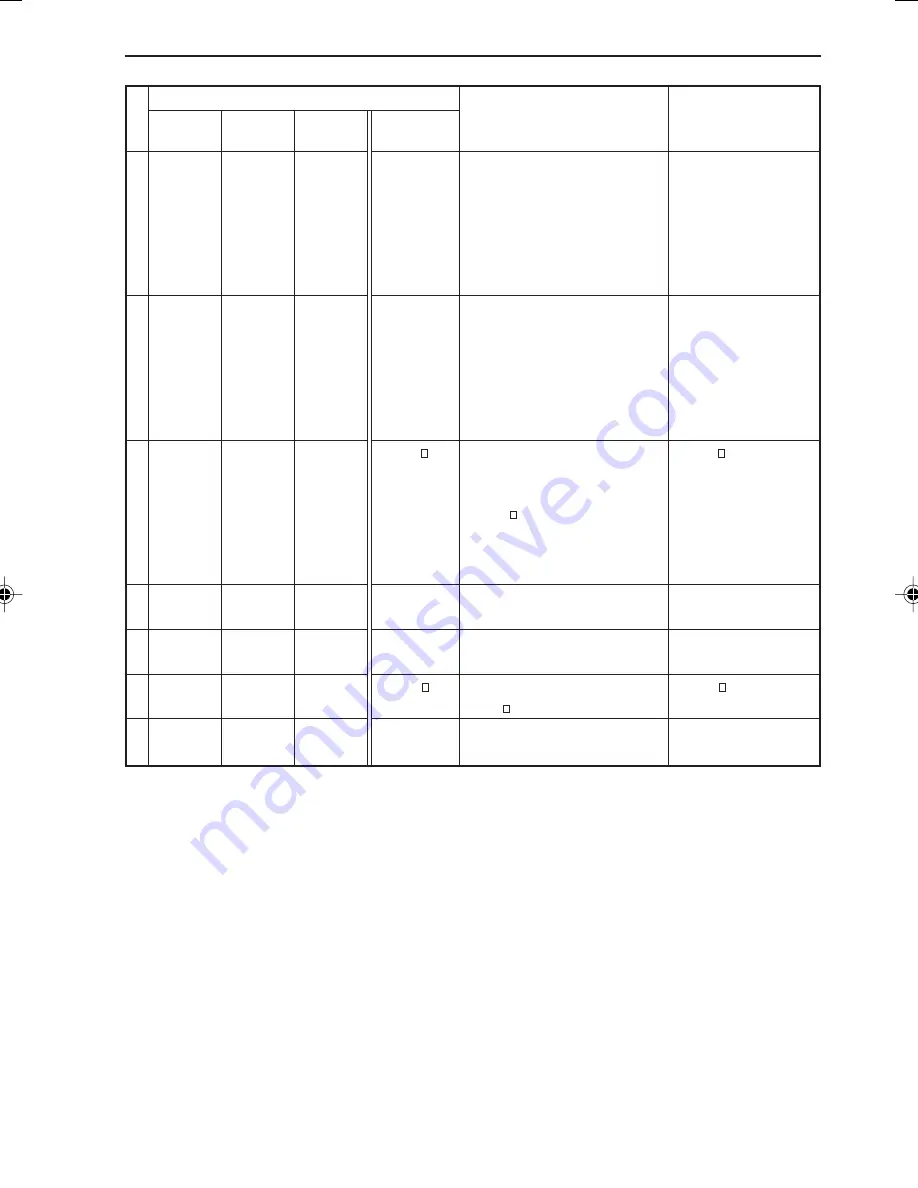
Major-
Sub-
Minor-
Name
Description
Example of use
category category category
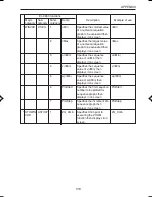
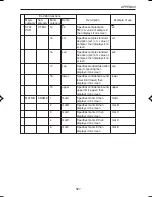
STAT
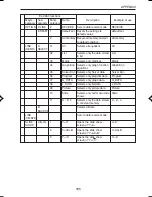
F MBOX 1
MBox •
Specifies modified box plot.
MBox •
GRAPH
The lines on either side are
(Q3–Q1)
×
1.5
Uses “•” to draw data points
(including Xmin and Xmax)
of the lines that are on the
outside
2
MBox +
Specifies modified box plot.
MBox +
The lines on either side are
(Q3–Q1)
×
1.5
Uses “+” to draw data points
(including Xmin and Xmax)
of the lines that are on the
outside
3
MBox
Specifies modified box plot.
MBox
The lines on either side are
(Q3–Q1)*1.5
Uses “ ” to draw data points
(including Xmin and Xmax)
of the lines that are on the
outside
G S.D.
1
Scattr •
Specifies scatter diagram
Scattr •
with “•” as data points
2
Specifies scatter diagram
with “+” as data points
3
Scattr
Specifies scatter diagram
Scattr
with “ ” as data points
H
1
xyLine •
Specifies xyLine with “•” as
xyLine •
XYLINE
data points
EL-9650-Appendix (327-338)
8/1/00, 9:41 AM
333
Summary of Contents for EL-9650
Page 10: ...viii ...
Page 46: ...36 CHAPTER 1 ...
Page 230: ...220 CHAPTER 9 ...
Page 268: ...258 CHAPTER 12 ...
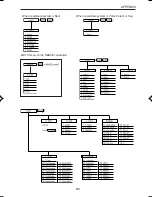
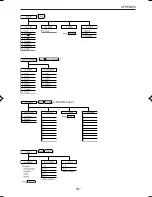
Page 349: ...339 APPENDIX When coordinate system is Rect param or polar ...
Page 350: ...340 APPENDIX When coordinate system is Seq F STYLE2 E STYLE1 ...
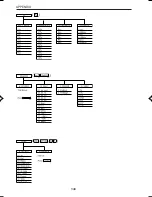
Page 352: ...342 APPENDIX ...
Page 353: ...343 APPENDIX on Program screen ...
Page 354: ...344 APPENDIX ...
Page 355: ...345 APPENDIX ...
Page 356: ...346 APPENDIX ...
Page 357: ...347 APPENDIX ...
Page 358: ...348 APPENDIX ...

