86
CHAPTER 4
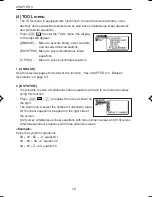
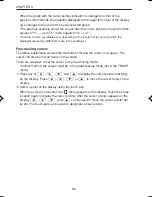
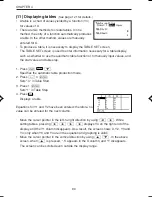
When the graph with the cursor pointer indication is changed in either of the
previous two methods, the equation displayed at the upper left corner of the display
also changes to the one for the newly selected graph.
(The previous example shows the screen after the cursor pointer is moved from the
equation “Y1 = –(x+2)
2
+5” to the equation “Y2 = x–2”.)
*
Since the X and Y coordinates vary depending on the location of the cursor pointer, the
displayed values may differ from those in the examples.)
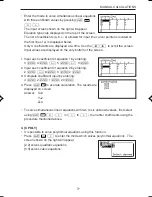
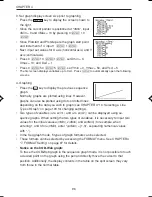
Free-moving cursor:
The above explanation showed the methods of moving the cursor on a graph. The
cursor can also be moved freely on the screen.
There are two ways to set the cursor to the free-moving mode.
In either method, the screen must be in the graph display mode (not in the TRACE
mode).
1
Press any of
<
,
>
,
≥
, and
≤
to display the cursor pointer (flashing)
on the display. Press
<
,
>
,
≥
, or
≤
to move the cursor freely on the
display.
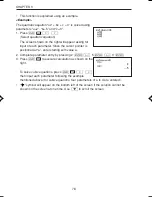
2
Select a point on the display using the touch-pen.
When the screen is touched, the “
” mark appears on the display. Touch the same
location again to display the cursor pointer. After the cursor pointer appears on the
display,
<
,
>
,
≥
, and
≤
can be used to move the cursor pointer dot
by dot. The touch-pen can be used to designate a new location.
EL-9650-(04)En (079-134)
8/7/00, 9:07 PM
86
Summary of Contents for EL-9650
Page 10: ...viii ...
Page 46: ...36 CHAPTER 1 ...
Page 230: ...220 CHAPTER 9 ...
Page 268: ...258 CHAPTER 12 ...
Page 349: ...339 APPENDIX When coordinate system is Rect param or polar ...
Page 350: ...340 APPENDIX When coordinate system is Seq F STYLE2 E STYLE1 ...
Page 352: ...342 APPENDIX ...
Page 353: ...343 APPENDIX on Program screen ...
Page 354: ...344 APPENDIX ...
Page 355: ...345 APPENDIX ...
Page 356: ...346 APPENDIX ...
Page 357: ...347 APPENDIX ...
Page 358: ...348 APPENDIX ...

