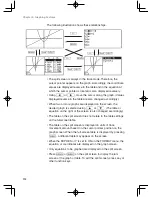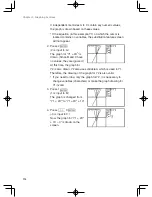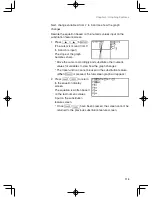
113
Chapter 4: Graphing Features
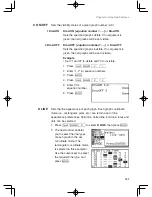
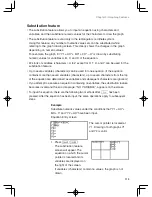
Example
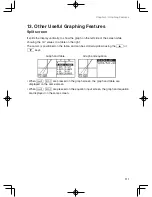
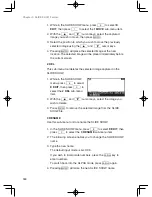
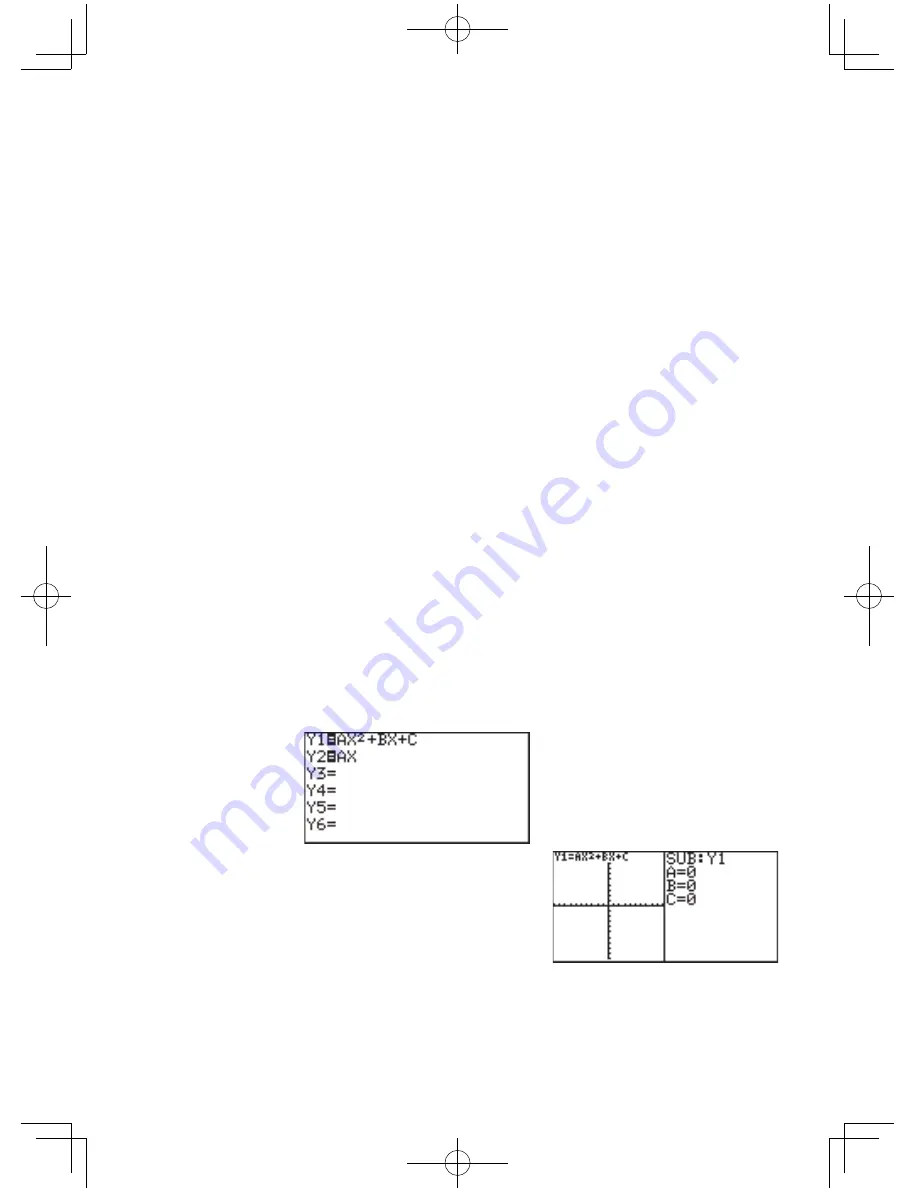
Substitute numeric values under the conditions that “Y1 = AX
2
+
BX
+
C” and “Y2 = AX” have been input.
Equation Entry screen
The cursor pointer is located at
Y1. Drawing of both graphs Y1
and Y2 is valid.
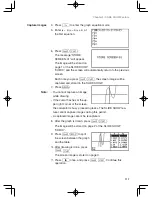
1. Press
@
,
.
The substitution feature
screen will appear. The
equation on which the cursor
pointer is located and its
variables are displayed on
the right of the screen.
If variables (characters) contain no values, the graph is not
drawn.
Substitution feature
• The substitution feature allows you to input an equation using characters and
variables, and then substitute numeric values for the characters to draw the graph.
• The substitution feature is valid only in the rectangular coordinate system.
Using this feature, any number of numeric value sets can be substituted while
referring to the graph drawing screen. This clearly shows the changes in the graph
depending on numeric values.
For example, the graph for “Y1 = AX
3
+
BX
2
+
CX
2
–
D” is drawn by substituting
numeric values for variables A, B, C, and D of the equation.
• 22 kinds of variables (characters), A to Z except for R, T, X, and Y can be used for the
substitution feature.
• Up to seven variables (characters) can be used for one equation. (If the equation
contains more than seven variables (characters), up to seven characters from the top
of the equation are determined as variables and subsequent characters are ignored.)
• If you attempt to execute an equation containing no variables, the substitution feature
becomes invalid and the error message, “NO VARIABLE”, appears on the screen.
• To input the equation, there are the following two methods after
Y
has been
pressed. After the equation has been input, the same operations apply to subsequent
steps.

