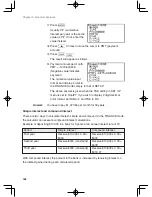
186
Chapter 9: Financial Features
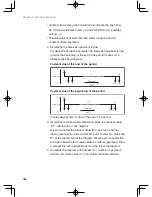
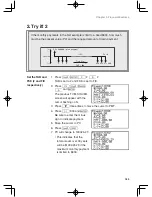
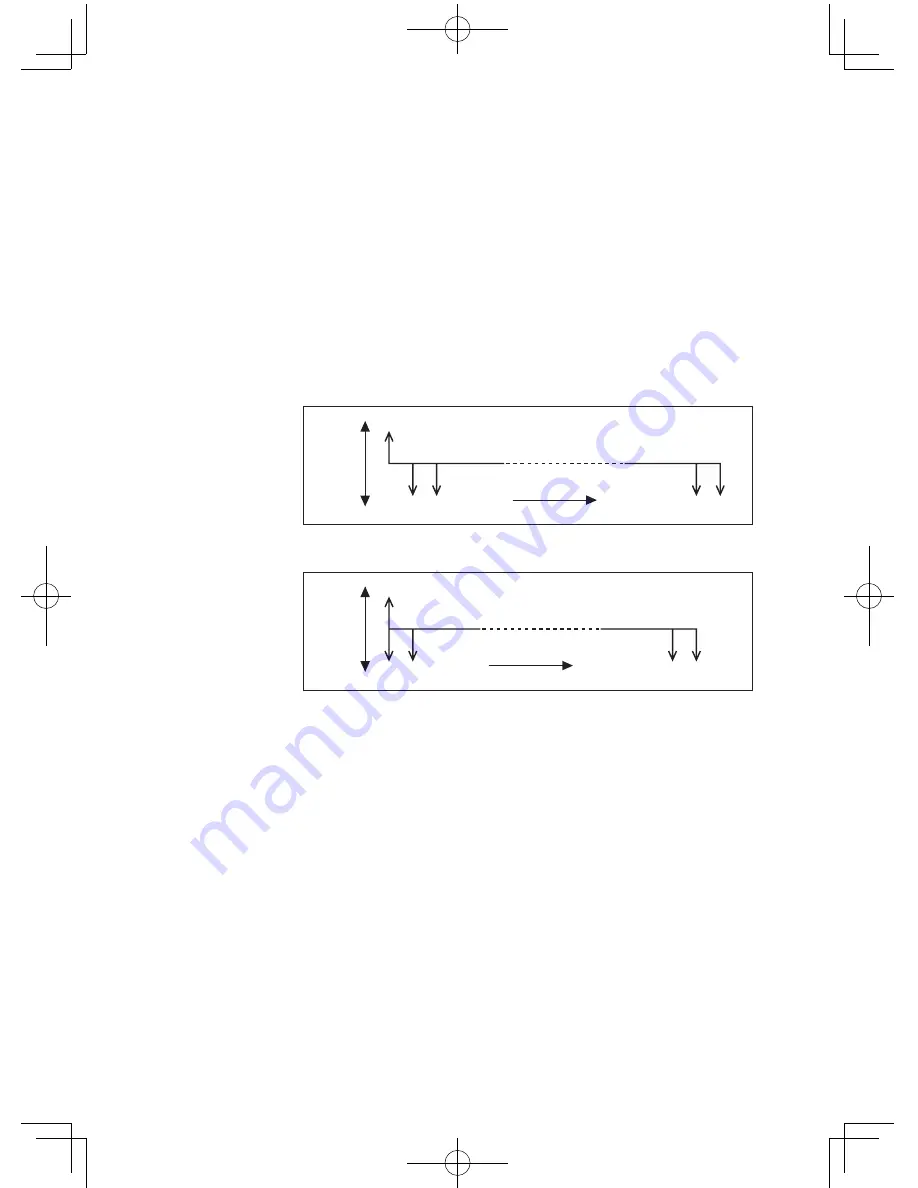
• Vertical arrows along the horizontal line indicate the cash flow.
An UP arrow indicates inflow (
+
) and a DOWN arrow indicates
outflow (
–
).
• The calculator considers the cash inflow for each period is
constant. (Even payment.)
2. Determine the time each payment is due.
For deposits and loan payments, the time each payment is due
(paid at the beginning or the end of the period) makes for a
different cash flow diagram.
Payment due at the end of the period
Payment due at the beginning of the period
In this case payment is due at the end of the period.
3. Determine the inflow and outflow and place the present value
(PV = $200,000) on the diagram.
We can consider the present value (PV) as a loan and thus
inflow (revenue) from the customer’s point of view. So, place the
PV at the top left end of the diagram. We also can consider the
principal interest total (Future value) as outflow (payment). Draw
a vertical line with a DOWN arrow on the top of the diagram.
4. Complete the diagram with interest (I%), number of payment
periods (N), future value (FV), and other required numbers.
Cash flow
PV
FV
PMT
Time flow
I %
N
N
–
1
2
1
(
+
)
(
–
)
Cash flow
PV
FV
PMT
Time flow
I %
N
N
–
1
2
1
(
+
)
(
–
)

