69
Chapter 4: Graphing Features
PROCEDURE
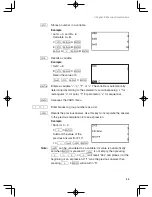
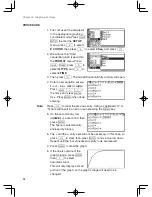
1. Press
Y
to enter the Graph Equation window. Six equation
entry areas appear, from “Y1=” to “Y6=”. Since we need only
two equations in this exercise, let’s use “Y1=” and “Y2=”.
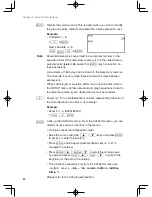
2. By default, the cursor should be placed on the right side of the
“Y1=” equation, next to the equal sign. If this is not so, use the
cursor keys to bring the cursor to the “Y1=” line, then press the
C
key to clear any entries. The cursor will automatically be
placed to the right of the equal sign.
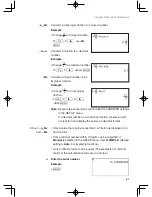
3. Enter the first equation, “2
+
1.8X”, to represent the Tomato
Cab’s fare system.
2
+
1 . 8
X
Use the
X
key to enter the “x”, representing the distance in
miles.
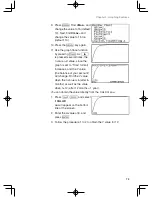
4. When the equation line is complete, press
E
. The first
equation is now stored, and the cursor automatically jumps to
the second line, where the second equation can be entered.
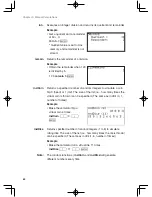
5. At the second line, press
C
to clear any entries,
then enter “3.5
+
1.2X” to
represent the Orange Cab’s
fare system. When done
entering the equation, press
E
. The two equations are now ready to graph.
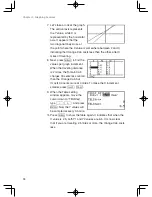
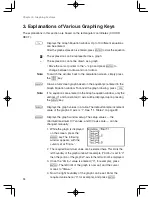
6. Press
G
to draw the graphs.
To draw a graph, “=” must be highlighted. If not, move the cursor
to “=” of the targeted equation and press
E
to draw a graph,
and press
E
again not to draw a graph.
Graph Basics
The graph examples in this exercise are called X-Y graphs. An
X-Y graph is quite useful for clearly displaying the relationship
between two variables.

