94
Chapter 4: Graphing Features
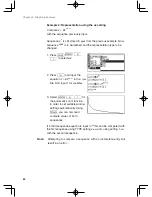
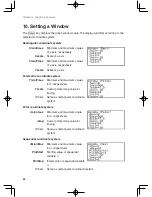
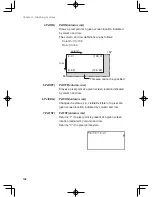
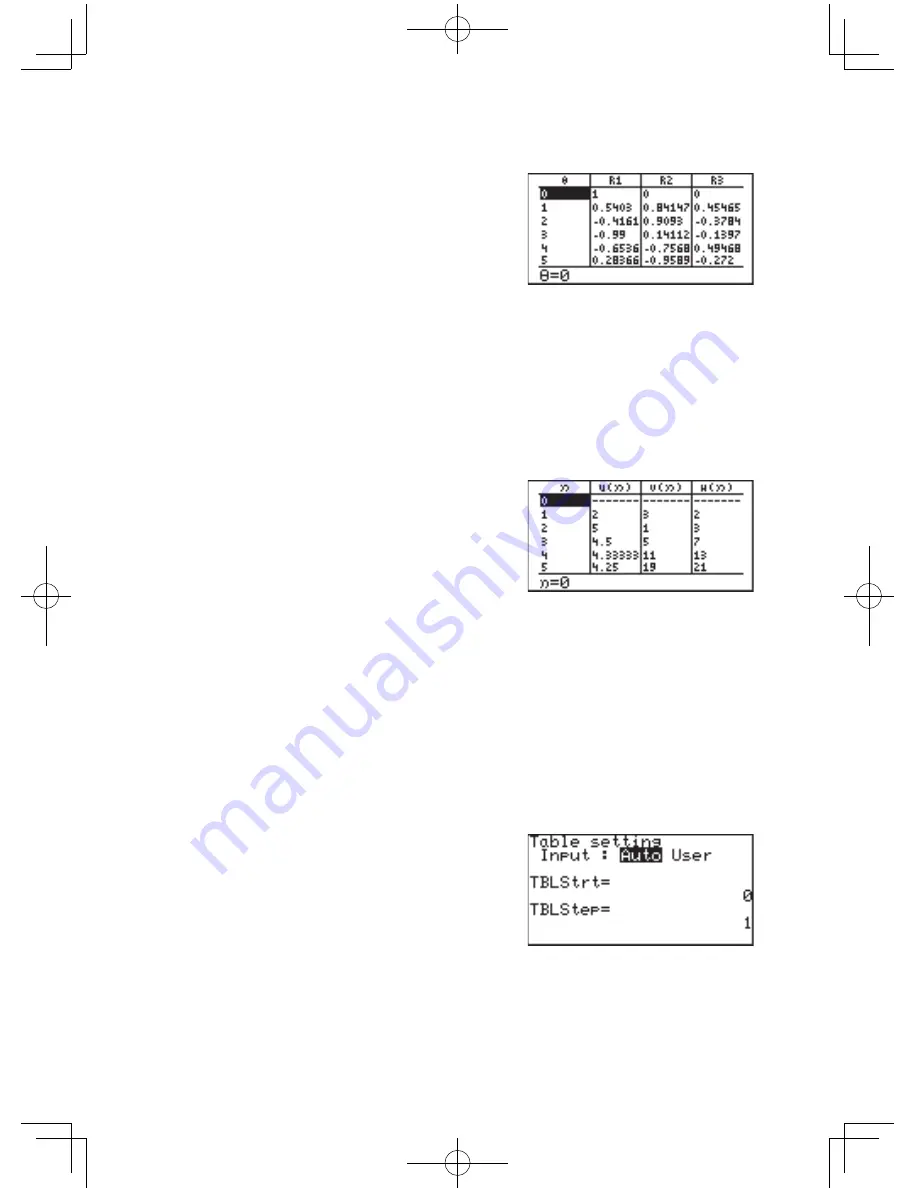
Polar coordinate system
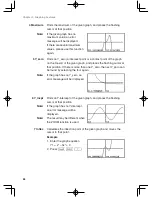
• The variable
θ
is displayed in
the left end column.
• The columns
θ
, R1 to R3 are
displayed on the first screen.
• Press
;
'
to
horizontally scroll the table.
• The 10-digit value in the column where the cursor is currently
located is displayed on the bottom line of the screen.
• The cursor can be moved using
;
'
{
}
.
• Non-input equation numbers and equations invalid for graphing
will not be displayed in the above table.
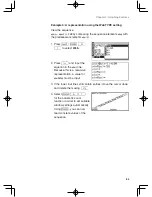
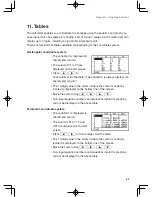
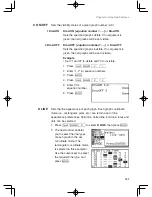
Sequential coordinate system
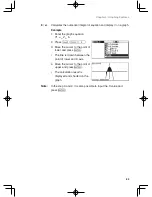
• The variable
n
is displayed in
the left end column.
• Tables values u(
n
), v(
n
), and
w (
n
) are simultaneously
displayed.
• The 10-digit value in the column where the cursor is currently
located is displayed on the bottom line of the screen.
• The cursor can be moved using
;
'
{
}
.
• Non-input equation numbers and equations invalid for graphing
will not be displayed in the above table.
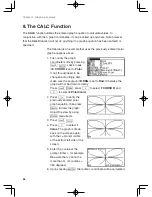
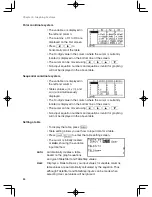
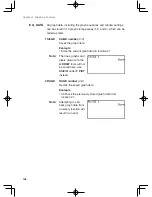
Setting a table
• To display the table, press
t
.
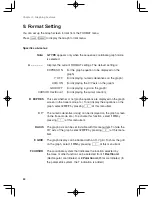
• Table setting allows you set how to input data for a table.
• Press
@
y
to enter the table setting screen.
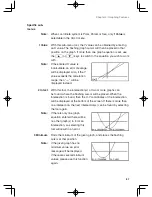
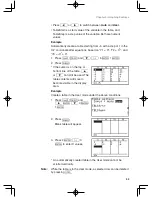
• The cursor is initially located
at
Auto, showing the variable
input method.
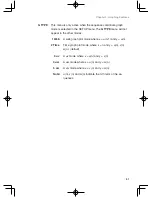
Auto: Automatically creates a table
based on the graph equations
and given TableStart and TableStep values.
User: Displays a blank table. As you input values for variable columns,
table values are automatically calculated by the equation. Thus,
although TableStart and TableStep inputs can be made when
selecting User, set values will be ignored.

