


62
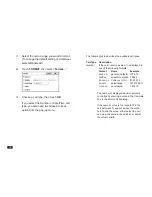
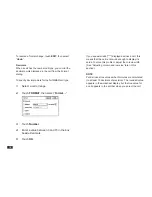
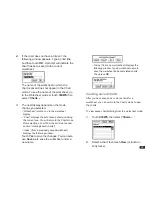
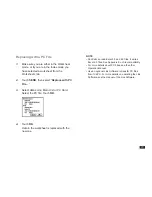
2.
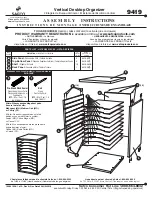
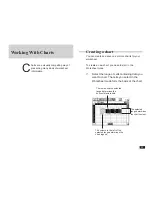
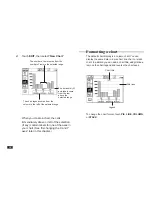
Touch EDIT, then select “New Chart.”
When you create a chart, the cells
immendiately above or left of the selection
(if any) contain labels for one of the axes in
your chart. (See “Exchanging the X and Y
axes” later in this chapter.)
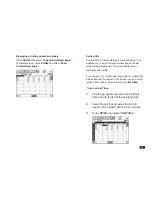
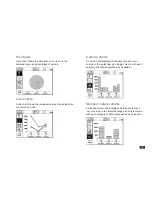
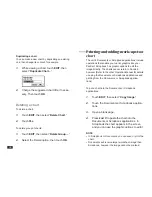
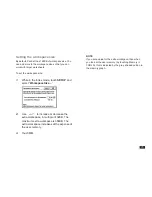
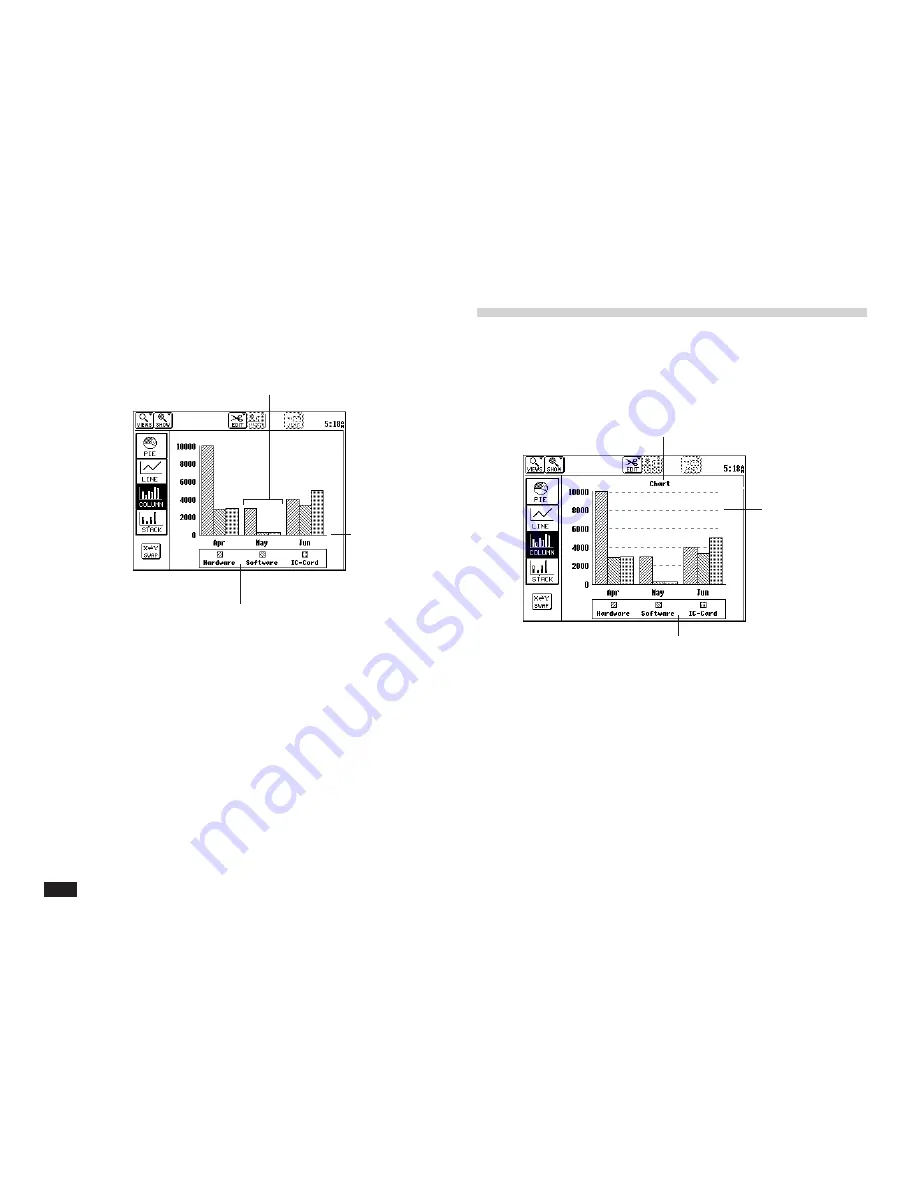
Formatting a chart
The default chart display is a column chart. You can
display the same data in a pie chart, line chart, or stack
chart. In addition you can add a chart title, add gridlines,
remove the chart legend and reverse the chart axes.
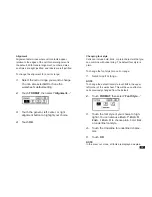
To change the chart format, touch PIE, LINE, COLUMN,
or STACK.
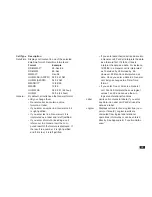
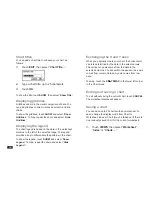
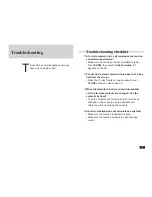
The number of bars comes from the
number of rows in the selected range.
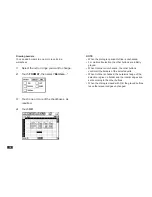
The horizontal (X)
axis labels come
from the row
above the
selected range.
The chart legend comes from the
column to the left of the selected range.
Chart title
Grid lines
Legend
Summary of Contents for Zaurus ZR-5700
Page 34: ...34 ...
Page 46: ...46 ...
Page 96: ...96 ...
Page 118: ...118 ...
Page 244: ...244 ...
Page 263: ...viii ...
Page 267: ...4 ...
Page 285: ...22 ...
Page 323: ...60 ...
Page 339: ...76 ...
Page 366: ...103 Communication Applications ...
Page 367: ...104 ...
Page 371: ...108 ...
Page 379: ...116 ...
Page 395: ...132 ...
Page 401: ...144 ...
Page 403: ...146 ...
Page 413: ...156 ...
Page 439: ...182 ...
Page 445: ...188 ...
Page 459: ...202 ...
Page 483: ...226 ...
Page 489: ...232 ...
Page 499: ...242 ...
Page 500: ...243 Terminal Introduction 245 Using Terminal 251 Troubleshooting 258 ...
Page 501: ...244 ...
Page 518: ...261 Index Spreadsheet 263 CompuServe 266 Pager Access 268 AT T Mail 270 Terminal 271 ...
Page 519: ...262 ...
Page 529: ...272 ...