Metering
42
8.3
Demand Configuration
8.3.1
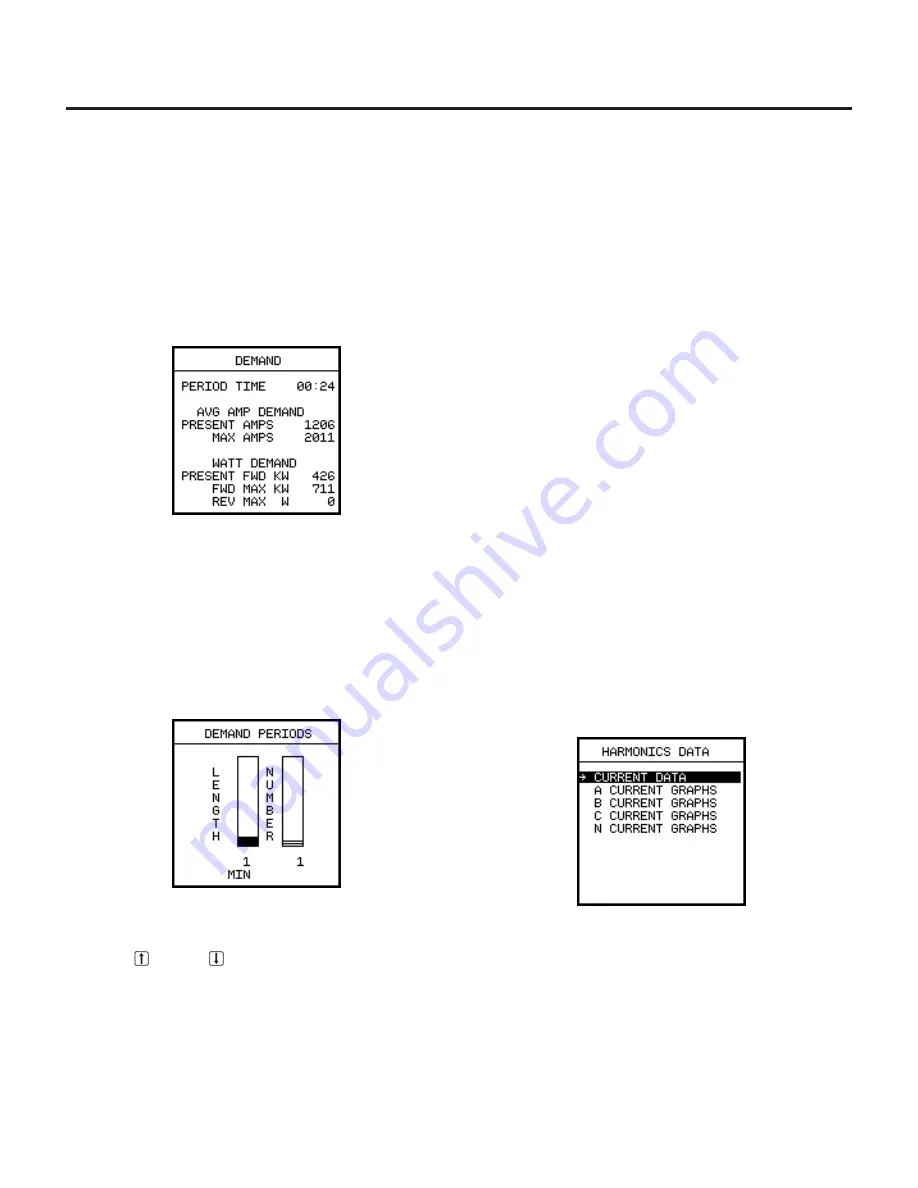
Viewing Demand Data
Two types of demand calculations are performed: amp
demand (demand current) and watt demand (demand power).
To view the demand data, from the
Metering Menu
, select
Metering Data,
and then select
Demand
.
The following display appears:
8.3.2
Setting Demand Parameters
The length of the demand period and the number of periods
are programmable, but they are the same for both amp
demand and kilowatt demand.
To set the demand parameters, from the
Main Menu
, select the
Metering Menu
. From the
Metering Menu
, select
Demand
Config
.
The following display appears:
The length of time of the demand calculation displayed in
Demand Periods
may be set to 1, 2, 5, 10, 12, 15, 20, 30, 60, or
90 minutes. The left column allows that to be adjusted by click-
ing the Up
or Down
Arrow keys while the Length function
is selected (darker). The number of periods per sliding window
demand calculation may be between 1 and 15 inclusive.
Demand is calculated by summing the three-phase average
current or the total watts over the interval, after which a new
value is calculated. At the end of the interval the sum is divided
by the number of samples. The calculations for demand values
are performed once per second.
If the number of demand periods is set to 1, then the maximum
demand is simply the largest demand value that has been cal-
culated since demand was last cleared. If the number of
demand periods is greater than 1, then a sliding window aver-
age calculation is performed. The maximum demand is the
largest average demand over the specified number of demand
periods.
Each time a new maximum demand value is calculated, the
oldest calculation is discarded and the new one is used to get
a new average. For example, if the length is set to 15 minutes
and the number of intervals is set to 15, at 15 intervals the max-
imum current and power demand is calculated based on the
first 15 measurements. After 16 intervals, the demand is calcu-
lated as the largest average demand during the second
through sixteenth intervals, with the first interval discarded.
8.4
Harmonics
The SB Energy-Comm trip unit is equipped with digital harmon-
ics sampling capabilities. This function can be independently
triggered by a user-defined setpoint condition or by a com-
mand issued from communications. The data can be viewed
on the display of the trip unit or it can be sent to a personal
computer and read remotely.
To view the harmonics data, from the
Main Menu
, select
Meter-
ing.
From the
Metering Menu
, select
Metered Data
. From the
Metered Data Menu
, select
Harmonics
.
The following display appears:
Harmonics are calculated on a per-phase basis using a Fast
Fourier Transform to convert from the sampled time domain to
the frequency domain. The harmonic calculation routine is acti-
vated by the metering task when one cycle worth of samples
has been collected for a given phase.


