Metering
44
8.5.2
Waveform Graphs
Waveform graphs allow the user to view the line and neutral
voltages and currents on a per-phase basis.
Sampled waveform data is stored in memory and can be read
via the communications port. The sampling rate used by the
SB Energy-Comm trip unit produces high-resolution data which
allows analysis of frequency components to the 19th harmonic.
To view the waveforms on the display of the trip unit, select
Metering
from the
Main Menu
. Then select
Metered Data,
and
then
Waveforms
.
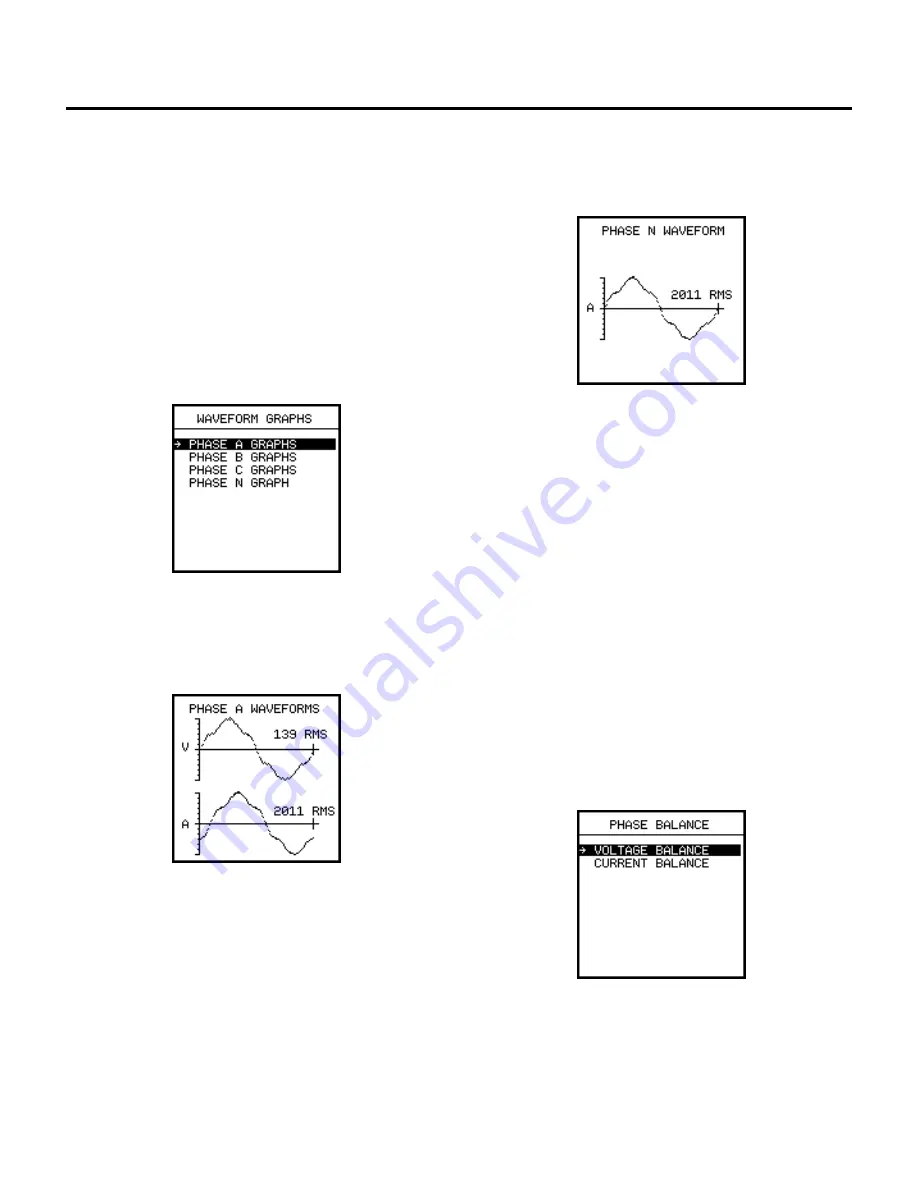
The following screen is displayed:
The list lets you select the data to be viewed from a particular
phase or neutral.
An example of the waveform on phase A as it appears on the
front display is shown below:
The display includes one full cycle of data of the rms voltage
(V) and the rms current (A). As this example shows, there are
harmonics that distort the waveform. Also note that the phase
relationship between voltage and current is shown.
An example of the waveform for the neutral line is shown with
only the current data in Amps (A).
Viewing the waveforms remotely from a personal computer
requires the Siemens WinPM or SB Win software. This software
can be used to upload waveform data from the trip unit to a
personal computer and display the waveforms on the com-
puter screen. WinPM software automatically performs a Fast
Fourier Transformation on each waveform. It then provides an
indication of total harmonic distortion and a breakdown of indi-
vidual frequency components in both graphical and tabular
form. This wide variety of data formats can help to quickly pin-
point the source and severity of harmonics, evaluate which
sources must be minimized, and develop corrective strategies.
8.5.3
Triggering Manually via Communications
With Siemens supervisory software, you can obtain graphical
waveforms for each of the eight possible inputs. A command
from the computer initiates data transfer from the trip unit. The
computer then uploads the data and displays the waveforms
on the screen.
8.6
Phase Balance
To view the phase balance data, from the
Metering Menu
,
select
Metered Data,
and then select
Phase Balance.
The following display appears:


