Operating the software
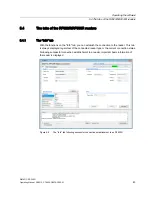
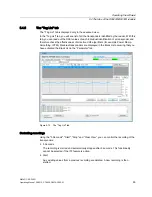
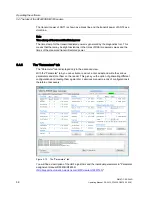
5.4 The tabs of the RF620R/RF630R readers
SIMATIC RF-DIAG
Operating Manual, 09/2012, C79000-G8976-C292-01
57
Note
Marking the transponders
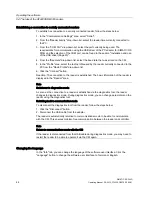
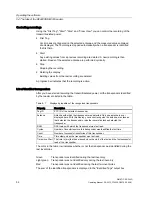
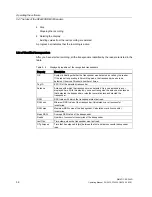
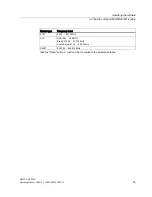
All transponders that remain following filtering of all activated algorithms are marked "OK".
The possible activated filters include the following:
1.
Black List
2.
Smoothing or Inventory Threshold Filter
3.
Sorting the ISTM
If the ISTM is activated, all transponders remaining after filtering 1 and 2 and that are within
the minimum distance of the set sorting criterion are marked as OK.
During processing on the PLC in the case above, if more than 1 transponder is marked with
"OK, no tag would be displayed in the Tag List. This applies only to Singletag Mode.
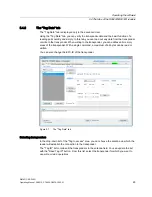
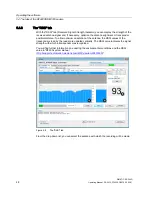
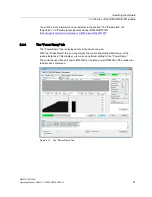
To make it easier to identify the transponders and to assign the transmit/radiated power, the
transponders are shown in different colors. 10 different colors are available for distinguishing
the transponders. If more transponders were read than the available colors, the colors are
repeated.
Transponders can be selected individually in the table. The selected transponder is
highlighted with the selection color set in Windows.
The sum of the identified transponders is displayed in the "Identified Tags" output box.
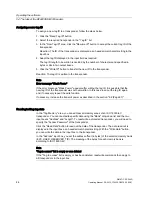
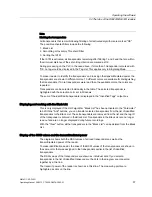
Displaying and working with the Black List
This is only displayed if the UHF algorithm "Black List" has been activated in the "Parameter"
tab. With the "Add" buttons, you can transfer selected transponders from the list of identified
transponders to the Black List. These transponders are removed from the list and the tag ID
of the transponder is entered in the Black List. Transponders in the Black List are no longer
read out and are no longer displayed during future recordings.
With the "Clear" button, all the transponders in the "Black List" can be deleted from the Black
List.
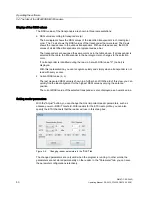
Display of the RSSI values and the transmit/radiated power
The diagram shows both the RSSI values of all read transponders as well as the
transmit/radiated power of the reader.
To make identification easier, the lines of the RSSI values of the transponders are shown in
the same color that was assigned to the transponders earlier in the list of identified
transponders.
The RSSI values of the transponders are shown as individual dots. If you select a
transponder in the list of identified transponders, the dots in the diagram are connected
together by a thin line.
The transmit power of the reader is shown as a thick line. The measuring points are
highlighted as dots on the line.

