Displaying operating data and alarms
6.1 The Management Explorer
SIMATIC IPC DiagMonitor V5.1.6
22
Operating Manual, 05/2021, A5E50981422-AA
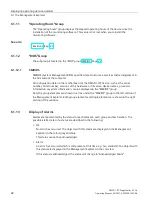
6.1.11
"Operating Hours" Group
The "Operating hours" group displays the elapsed operating hours of the device since the
installation of the monitoring software. This value is not lost when you reinstall the
monitoring software.
See also
6.1.12
"BIOS" Group
The subgroup is located in the "BIOS" group SMBIOS (Page 22).
6.1.12.1
SMBIOS
SMBIOS (System Management BIOS) specifies data structures, as well as their arrangement in
the firmware of the computer.
All configuration data on the motherboard of the SIMATIC IPC device, such as the serial
number, order number, versions of the hardware or firmware, device names, processor
information or system information, can be displayed in the "SMBIOS" group.
Only the group elements are shown in a tree under the "SMBIOS“ group in the left section of
the Management Explorer. Both group elements and single elements are shown in the right
section of the window.
6.1.13
Display of Alarms
Alarms are represented by the status for each element, each group and each station. The
possible alarm states of a status are described in the following:
•
Ok
No error has occurred. The objects with this status are displayed in the Management
Explorer in the colors gray and blue.
This status cannot be acknowledged.
•
Alarm
An error has occurred which is still present at this time, e.g. fan standstill. The objects with
this status are displayed in the Management Explorer in the color red.
If this status is acknowledged, the status will change to "Acknowledged Alarm".


