Plant Visualization
253
7SS52 V4 Manual
C53000-G1176-C182-3
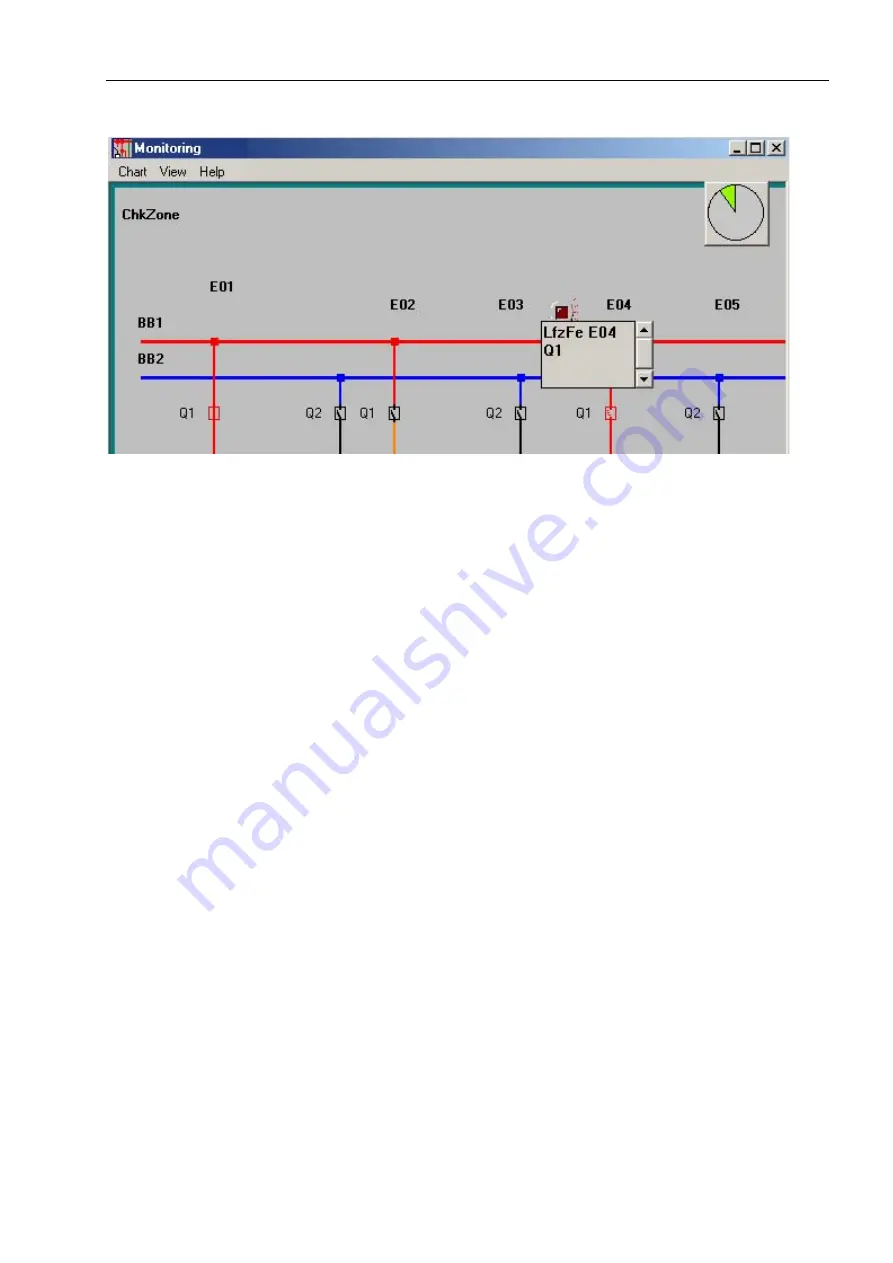
Figure 6-35 LED with Information Window
UpdatingCycle
The visualization in DIGSI is updated cyclically. The clock displayed in the upper right
corner shows the current update status. See Figure 6-35, page 253.
When the circle is entirely filled up at "12 o'clock" the update has been completed.
Plant View and
Protected View
The Plant View corresponds to the actual statuses of the binary inputs CLOSED,
OPEN and Intermediate/Running Position. It is visualized directly in the circuit
symbols.
The coloration of the zones corresponds to the Protected View and is done at the end
of the updating cycles. For example, an isolator in running position is treated as
"CLOSED".
The assignment of the feeders to a relevant busbar is indicated by a certain colour.
This means that the line and the switchgear symbols are in the same colour as the
corresponding busbar.
When a sectionalizing isolator or sectionalizer fork is closed, the busbar section with
the lower number (BB, ...) has a higher priority than the busbar section with a higher
number (..., TB12) (preference). The busbar section with the higher number takes over
the colour of the busbar section with the lower number.
The colour change corresponds to the actual measuring range of the protection. This
is possible up to the current transformer or circuit breaker, depending on the positions
of the circuit breaker and current transformer. Only the measured value boxes of the
busbar with the higher priority will be displayed.
During configuration and having selected an object use the right mouse button in the
menu
Object Properties
to determine the colours to be used in the visualization.
www
. ElectricalPartManuals
. com


