68 SDG6000X User Manual
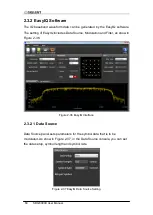
Figure 2-43
Waveform Spectrum
The horizontal coordinate shows the Frequency values in Hz and the vertical
coordinate shows the Magnitude values in dB.
IQ Waveform Display
After clicking “IQ Waveform” tab, the Time domain plot of modulated IQ data is
displayed.
Figure 2-44
Time-domain Waveform
The I/Q data plots are displayed separately in two graphs. The horizontal
coordinate shows the symbol values and the vertical coordinate shows the
amplitude values of I/Q data.
2.3.2.5 Waveform Download
Click the
button on the top of the window, the download interface is
displayed as show in Figure 2-45. You can download the IQ baseband data
Summary of Contents for SDG6000X Series
Page 2: ......
Page 45: ...SDG6000X User Manual 35 Figure 2 16 Setting the Bandwidth...
Page 142: ...132 SDG6000X User Manual Figure 2 95 Phase Deviation Interface...
Page 160: ...150 SDG6000X User Manual Figure 3 1 Generate a Sine Waveform...
Page 162: ...152 SDG6000X User Manual Figure 3 2 Generate a Square Waveform...
Page 175: ...SDG6000X User Manual 165 Figure 3 9 Generate an AM Modulation Waveform...
Page 177: ...SDG6000X User Manual 167 Figure 3 10 Generate a FM Modulation Waveform...
Page 179: ...SDG6000X User Manual 169 Figure 3 11 Generate a PM Modulation Waveform...
Page 181: ...SDG6000X User Manual 171 Figure 3 12 Generate a FSK Modulation Waveform...
Page 183: ...SDG6000X User Manual 173 Figure 3 13 Generate an ASK Modulation Waveform...
Page 185: ...SDG6000X User Manual 175 Figure 3 14 Generate a PSK Modulation Waveform...
Page 187: ...SDG6000X User Manual 177 Figure 3 15 Generate a PWM Modulation Waveform...
Page 189: ...SDG6000X User Manual 179 Figure 3 16 Generate a DSB AM Modulation Waveform...

