SDS5000X Series Digital Oscilloscope User Manual
WWW.SIGLENT.COM
211
18.7
Statistics Histogram
After enabling statistics on a selected measurement, you can also activate
statistical histogram. The histogram appears at the bottom of the statistics area.
This enables users to quickly view the probability distribution of the measured
parameters. The color of the histogram is consistent with the measurement
source (Channel 1 is yellow, etc.).
Touch the histogram area of a parameter to enlarge it for details. You can move
the large histogram window position around the display by dragging. Touch the
histogram of another parameter to switch to the corresponding enlarged
histogram.
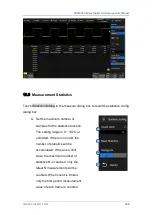
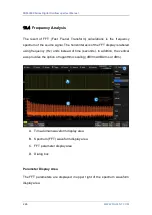
A. Parameter
B. Histogram display area. X-axis represents measured values and Y-
axis represents the probability.
Summary of Contents for SDS2000X Plus
Page 1: ...SDS5000X Series Digital Oscilloscope User Manual UM0105X E01E...
Page 2: ......
Page 158: ...SDS5000X Series Digital Oscilloscope User Manual 156 WWW SIGLENT COM Ack Acknowledge bit...
Page 165: ...SDS5000X Series Digital Oscilloscope User Manual WWW SIGLENT COM 163...
Page 240: ...SDS5000X Series Digital Oscilloscope User Manual 238 WWW SIGLENT COM...
Page 248: ...SDS5000X Series Digital Oscilloscope User Manual 246 WWW SIGLENT COM...
Page 361: ...SDS5000X Series Digital Oscilloscope User Manual WWW SIGLENT COM 359...


