143 SNA5000A Vector Network Analyzer User Manual
noise or noise-like signal.
4.
Normal
Normal detector (also called ROSENFELL Detector) displays the maximum value and the
minimum value of the sample data segment in turn: Odd-numbered data points display
the maximum value and even-numbered data points display the minimum value. In this
way, the amplitude variation range of the signal is clearly shown.
5.
Average
For each trace point, Average detector displays the average value of data sampled within
the corresponding time interval.
6.3.2.6
Averaging Type
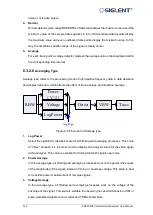
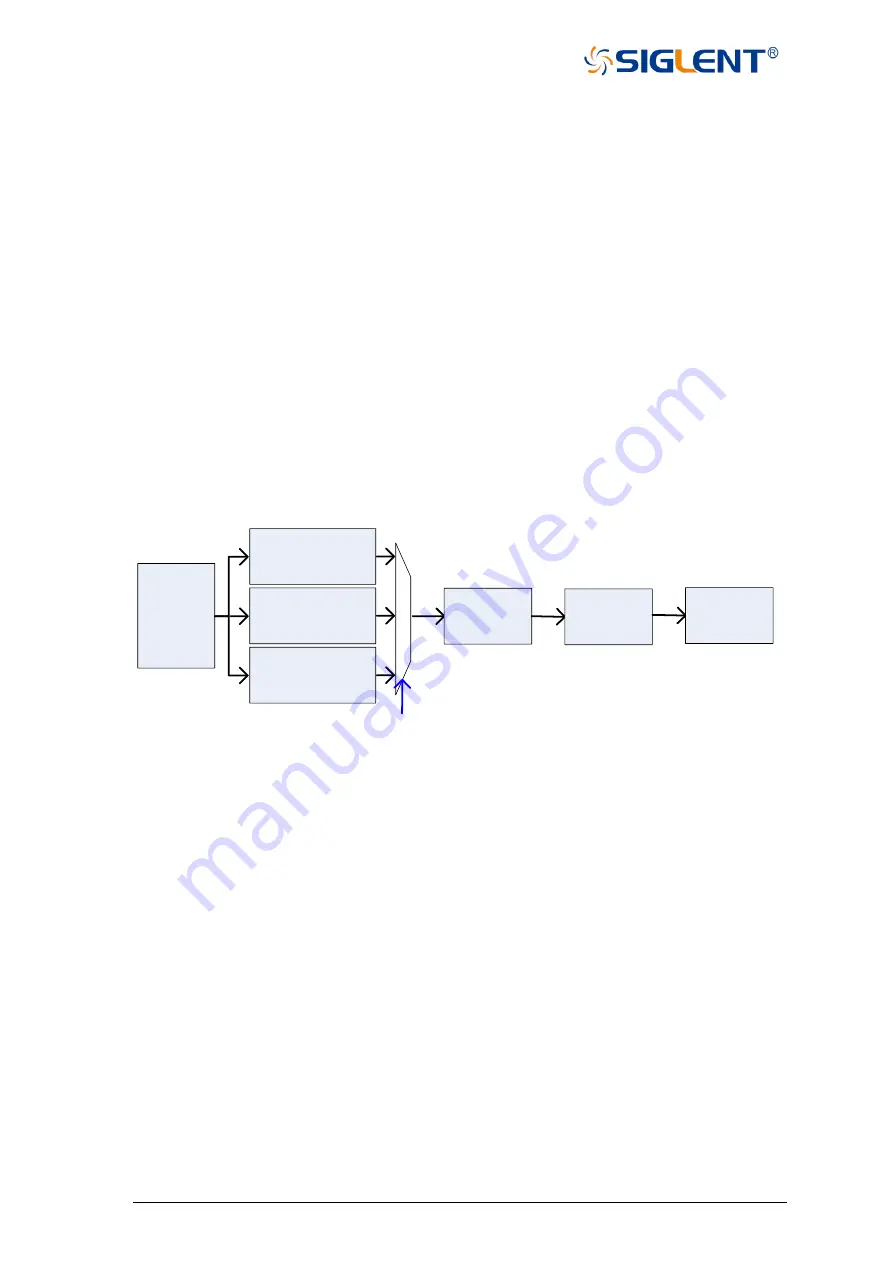
Average type refers to the processing mode of intermediate frequency data in data detection
and display detection, which affects the effect of trace average and detection average.
Power
(
V^2
)
RBW
Voltage
LogPower
Detect
Avg Type
VBW
Trace
Figure 6-6 Flow chart of Average type
1.
Log Power
Select the logarithmic (decibel) scale for all filtering and averaging processes. This scale
is "Video" because it is the most common display and analysis scale for the video signal
within analyzer. This scale is excellent for finding Sine/
CW signals near noise.
2.
Power Average
In this average type, all filtering and averaging processes work on the power (the square
of the magnitude) of the signal, instead of its log or envelope voltage. This scale is best
for real-time power measurement of complex signals.
3.
Voltage Average
In this Average type, all filtering and averaging processes work on the voltage of the
envelope of the signal. This scale is suitable for observing rise and fall behavior of AM or
pulse-modulated signals such as radar and TDMA transmitters.
Summary of Contents for SNA5000A Series
Page 2: ......

