background image


37                                                                                                  SNA5000A Vector Network Analyzer User Manual 


Measurement trigger input: This signal is easy to use, but has limited configuration   

capabilities. 


Auxiliary trigger outputs: Connectors and signals are highly configurable and can be used   

to synchronize with any number of devices. 
 

Measurement trigger input 

The trigger input connector is located on the back panel of the vector network analyzer. 

These  signals  can  be  used  when  the  vector  network  analyzer  communicates  with  slower 
instruments. 


Operating Steps: 


The vector network analyzer sends a "ready" signal when it is ready for measurement 


The external device sends a trigger signal to the vector network analyzer when it is ready 
for measurement 


Additional signals are provided on the vector network analyzer processor I/O to indicate 
that the vector network analyzer sweep has been completed and the processor can be set 
for the next measurement. 


To make the vector network analyzer respond to measured trigger inputs or processor I/O 

signals, select External on the “Trigger Settings“  tab on the “Source“ Settings. Also, on the 
Trigger Settings tab, on the Range Settings, select whether an external trigger applies to all 
channels (global) or one channel (local). The appropriate settings to apply are as follows: 
Main trigger input: 


Global/channel trigger delay - after receiving an external trigger, the start time of the sweep 

will be delayed by the specified amount of time plus any inherent delay. 


When the trigger scope is "channel", the delay value is applied to the specified channel. 


When the Trigger Range is Global, the same delay value is applied to all channels. 

 
The vector network analyzer receives the trigger input signal through the following connectors:


Measure trigger input BNC connector: Trigger input on the rear panel. 


Processor I/O Pin 18 (needs to be changed). 
 

Polarity: 

High level: When the vector network analyzer is ready (trigger ready) and the TTL signal on 

the selected input is "high", It triggers the vector network analyzer. 


Low level: When the vector network analyzer is ready (trigger ready) and the TTL signal on the 

selected input is "low", it triggers the vector network analyzer. 


Summary of Contents for SNA5000A Series

Page 1: ...I SNA5000A Series Vector Network Analyzer UserManual UM09050 E01A SIGLENT TECHNOLOGIES CO LTD User Manual UM09050 E01C...

Page 2: ......

Page 3: ...CHNOLOGIES CO LTD Information in this publication replaces all previously corresponding material SIGLENT reserves the right to modify or change parts of or all the specifications or pricing policies a...

Page 4: ...e switch the VNA will switch between the working state and the standby state The switch could not power off the device to completely power off the VNA the power cord must be removed from the AC socket...

Page 5: ...instrument is cooled through a built in fan To keep adequate ventilation a gap of at least 15 cm should be left on both sides as well as the front and rear panels of the instrument CAUTION Do not blo...

Page 6: ...tion cycle is one year Calibration should only be performed by qualified personnel Cleaning Only a soft damp cloth without any chemical corrosive substances can be used to clean the instrument Do not...

Page 7: ...nse and Enhanced Response for increased flexibility in R D and manufacturing applications Features Frequency range 9 kHz 8 5 GHz Ports 2 4 Frequency resolution 1 Hz Level resolution 0 05 dB Range of I...

Page 8: ...surement calibration This chapter introduces the different calibration methods of S parameters power calibration methods test fixture and other functions of vector network analyzer in detail Chapter 4...

Page 9: ...1 6 1 Active entry 18 1 6 2 Value of marker 19 1 6 3 Trace State 19 1 6 4 Channel State 19 1 6 5 Function Keys 19 1 6 6 Label Page 20 1 6 7 Window State 20 1 6 8 Stimulus Range 20 1 6 9 Status Bar 20...

Page 10: ...Averaging 48 2 8 3 IF Bandwidth 49 2 8 4 Smoothing 50 2 9 Preset instructions 51 3 Measurement calibration 52 3 1 Overview 52 3 2 Calibration type 53 3 3 S parameter calibration 56 3 3 1 S parameter c...

Page 11: ...For The TDR Option 121 5 1 Overview 121 5 2 Open Close Preset TDR Option 122 5 3 TDR Setup Wizard 122 5 4 Calibration for TDR Option 122 5 4 1 Deskew 122 5 4 2 Deskew Loss Compensation 123 5 5 TDR Ch...

Page 12: ...Diagram Scale Management 134 5 8 6 Mask Test for Eye Diagram 134 5 8 7 Jitter Statistical Eye Diagram 134 5 9 TDR Advanced Waveform Function 135 5 9 1 Viewpoint 135 5 9 2 Emphasis De emphasis 136 5 9...

Page 13: ...1 Dimensions Figure 1 1 Front view and side view Figure 1 2 Rear panel view 1 2 Power supply The equipment accepts 100 240V 50 60 400Hz AC power supplies Please use the power cord provided to connect...

Page 14: ...otes Avoid touching the LCD touchscreen with sharp objects The effective pixel ratio of the screen is more than 99 998 so it doesn t mean a fault when the screen has some black blue green red fixed po...

Page 15: ...R Phase and so on Marker Set markers to obtain the value of measurement parameters Math Contains storing measurement data in memory comparing current data with previous data time domain analysis of me...

Page 16: ...input of the active function area and exit the parameter input state Press this button to return to local control if previously controlling the instrument remotely During the parameter editing process...

Page 17: ...ng an RF signal the corresponding orange light above the RF connector will be lit To avoid damage to the instrument the RF connector input signal must meet the following The DC voltage and the maximum...

Page 18: ...transmitting signal will be locked into this 10 MHz external reference signal Otherwise the VNA s transmitting signal will be locked into the internal 10 MHz reference signal 10MHz Ref Signal Output...

Page 19: ...rated current of the fuse 1 5 OCXO option installation guide Power off the instrument use a screwdriver to remove the cover where the OCXO option is located on the rear panel Cover Figure 1 8 OCXO opt...

Page 20: ...B Marker Readout C Trace Status D SoftKeys E Softtabs F Window number G Stimulus Range H Status Bar I Message Bar 1 6 1 Active entry Table 1 5 Active entry description Functions Functions Description...

Page 21: ...traces between Windows keeping the trace to the maximum or minimum value without displaying the current value etc Select a trace line and press the Scale button to change the reference electric equali...

Page 22: ...window maximizing a window layout and so on 1 6 8 Stimulus Range Displays the excitation signal set in the current window including starting frequency ending frequency internal source output power etc...

Page 23: ...des a basic graffiti function which is used to draw graphics and mark information on the main interface This feature is great for annotating screenshots and adding important details before saving Graf...

Page 24: ...tool Draw a series of lines arbitrarily in the interface double click the mouse double click the finger on the screen to finish drawing 7 Delete tool Delete the currently selected drawing 8 Text colo...

Page 25: ...f the color 2 Color selection tool Select a specific color 3 Color transparency tool Adjust color transparency the more right the lower color transparency Figure 1 14 Line thickness adjustment interfa...

Page 26: ...isplay light is on the touch screen function is on When the Touch button display light is off the touch screen function is off Sliding the screen up and down to display the coordinates of the vertical...

Page 27: ...y The excitation port is also known as the transmitting port of the vector network analyzer The output signal of this port is provided to the DUT Here is a list of common S parameter measurements Refl...

Page 28: ...Balanced balanced 2 logical ports 4 actual ports Single ended balanced 2 logical ports 3 actual ports Single ended Single Ended Balanced 3 logical ports 4 actual ports 2 1 3 Power measurement of rece...

Page 29: ...nning measurement range Stop Specify the end frequency of the scanning measurement range Center Specify a center frequency value which can be anywhere in the range of the vector network analyzer Span...

Page 30: ...Press Power use the knob or arrow keys to focus on the Port Power Select parameter item Press ENTER or the knob to select the corresponding power port 5 Press Power use the knob or arrow keys to focus...

Page 31: ...nents For amplification use a positive offset and for attenuation use a negative offset Using the Softkey for setting Press the Power key Power Leveling Offsets then enter the menu A Select the Port B...

Page 32: ...ects On indicate that power is limited to the adjacent value at the specified source port and selects Off indicate that power is not limited to this value but the maximum power of the source C Set the...

Page 33: ...bration and measurement Points are the number of data items collected in one sweep This number can be set separately for each channel To obtain high trace resolution for excitation values select a lar...

Page 34: ...nts the measurement values of one or more segments can be calibrated In the segmented scan type the vector network analyzer performs the following operations Sort all defined segments in order of incr...

Page 35: ...drawn on the screen This function is in the sub sweep table menu When X axis point spacing is not used multi segment sweeping traces may sometimes result in many measurement points being squeezed into...

Page 36: ...by external devices received through the BNC connector on the rear panel Manual trigger Manually send a trigger signal to the vector network analyzer Available only when you select Manual to trigger...

Page 37: ...l channels are single Restart Accessible only from the Trigger menu Channels that are in the Hold state are set to be a single trigger This channel receives a single trigger signal All other settings...

Page 38: ...riggering 2 causes all S parameters to be updated b When the calibration is off triggering 1 will cause S11 and S21 to be updated Triggering 2 will cause S22 and S12 to be updated Track sweep sequence...

Page 39: ...ts or processor I O signals select External on the Trigger Settings tab on the Source Settings Also on the Trigger Settings tab on the Range Settings select whether an external trigger applies to all...

Page 40: ...e edge has been received since the last data acquisition the vector network analyzer will trigger immediately after ready After receiving the trigger selection before being ready the vector network an...

Page 41: ...signal should be sent after the measurement is completed to indicate that the external source can be set for the next measurement Enable When checked the signal can be output to external devices using...

Page 42: ...to the specified position by the up and down arrow keys or the knob and press ENTER or the knob to select the current option 2 6 2 LF Cartesian coordinates display format Nine of the twelve available...

Page 43: ...ements Reflection and transmission coefficients amplitude time domain transformation SWR format Displays the reflection measurements calculated from the formula 1 R 1 R where R is the reflection coeff...

Page 44: ...e incident signal The phase differences of 90 180 and 90 correspond to the top leftmost and bottom of the polar display respectively 2 6 4 Smith circle diagram Smith diagrams are a tool for mapping co...

Page 45: ...Smith circle There is also a Reverse Smith circle diagram also called an Admittance Smith Chart Same as the standard Smith circle with the following exceptions The polar grid is reversed from right t...

Page 46: ...tmost value is zero ohms short circuit The dotted circle intersecting the horizontal axis represents a constant reactance A dashed arc tangent to the horizontal axis represents a constant impedance Th...

Page 47: ...Sets the value of the guide in rectangular format Range 1000 dB to 1000 dB In polar coordinates and Smith s circle chart formats the reference level does not apply Reference position Sets the position...

Page 48: ...method Close All traces in the working window are automatically scaled separately Window All traces in each selected window are automatically scaled to conform to a common set of scaling factors All A...

Page 49: ...tion keys or Knob Press ENTER or Knob to select the current option Amplitude deviation Offset the entire data trace at the specified value Margin slope Offset the data trace by some value that changes...

Page 50: ...ctive than reducing IF bandwidth Generally Averaging takes slightly longer than IF bandwidth reduction to lower noise especially if many averages are required Also changing the IF bandwidth after cali...

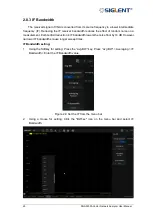
Page 51: ...random noise on a measurement Each tenfold reduction in IF bandwidth lowers the noise floor by 10 dB However narrower IF bandwidths cause longer sweep times IF Bandwidth setting 1 Using the Softkey f...

Page 52: ...e Softkey for setting Press the Avg BW key Avg BW Smoothing then enter the Smoothing menu Figure 2 11 Smoothing menu A Smooth On Off When is On applies smoothing to the displayed trace B Percent of Sm...

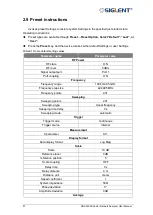
Page 53: ...r RF state ON RF level 0 dBm Signal output port Port 1 Port coupling ON Frequency Frequency range 100 kHz 8 5 GHz Frequency step size 42 4995 MHz Frequency points 201 Sweeping Sweeping points 201 Swee...

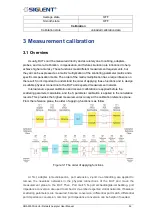
Page 54: ...ion to the DUT and expected measurement network Internal source power calibration and receiver calibration are applied before the scattering parameter calculation and the S parameter calibration is ap...

Page 55: ...wing are the actual S parameter calibration types used by this vector network analyzer Table 3 2 The vector network analyzer S parameter calibration types Port number Calibration type Calibration item...

Page 56: ...onse transmission tracking Source match Load match Frequency response reflection tracking Enhanced Response Application Calibrate two ports when only one direction forward or reverse is needed for mea...

Page 57: ...on kits Short circuit open circuit and load or ECAL module Corrected system error Directivity Frequency response reflection tracking Source match Open circuit response short circuit response Applicati...

Page 58: ...sed in the predefined calibration kit models Using standards or combinations of standards that are different from the predefined calibration kits For example using three offset SHORTs instead of an OP...

Page 59: ...name D Create a new custom Cal Kit E Select the Cal Kit F Save the current Cal kits both factory and custom G Recall the Cal Kits H Restore the default factory Cal Kits 3 3 1 2Connector Tab At the bot...

Page 60: ...rts the Add Connector dialog box which allows you to add a new connector type to the calibration kit C Select The selected connector family D Frequency Range Define the lowest and the highest frequenc...

Page 61: ...ure 3 5 The help dialog of the Standard A Identification Standard ID Number in list of standards Label Type of standard This usually appears in prompts for standards Description Description of standar...

Page 62: ...Z0 Defines the impedance of the standard Loss Defines energy loss in Gohms due to skin effect along a one way length of coaxial cable Open Standard C0 C1 C2 C3 Specify the fringing capacitance Figure...

Page 63: ...SOLT Tab Allows you to assign single or multiple standards to SOLT Calibration Classes 1 For each Cal Kit Class select Available Standards from the left list then click to copy the standard to the Cal...

Page 64: ...gth as the LINE standard If the insertion phase and electrical length are well defined the THRU standard may be used to set the reference plane The THRU standard and LINE standard have the same charac...

Page 65: ...oad standard the loads are measured separately The loads are assumed to have the same characteristics The impedance of the MATCH standard becomes the reference impedance for the measurement For best r...

Page 66: ...t F503ME Save Select the existing F503ME Cal Kit then save it to a local file named F503ME123 xkt Figure 3 12 Creating a Custom Cal Kit dialog box Figure 3 13 Save the ECal Kit 2 In the Manage Cal Kit...

Page 67: ...Vector Network Analyzer User Manual Figure 3 14 Import the new ECal Kit 3 Select the newly imported calibration click Edit to enter the calibration editing interface and modify the calibration name as...

Page 68: ...ters as you need 5 Click OK for the changed Cal Kit to take effect Method 2 Create a custom Cal Kit directly for new connector types 1 Press Cal Cal Cal Kit Insert 2 Enter the name and description of...

Page 69: ...rs Operating instructions Press the Cal key use the knob or the arrow key to make the focus fall on Basic Cal and press Enter to enter the setting interface of the calibration kit Figure 3 17 Calibrat...

Page 70: ...ation kit and click the corresponding calibration item menu on the interface After completion of the corresponding calibration item the percentage of calibration progress will be displayed in the lowe...

Page 71: ...device can be calculated by only connecting the OPEN calibration element to the test port If the LOAD calibration element is used for isolation calibration at the same time the directional error can...

Page 72: ...on at the same time the directional error can also be calculated Operating steps 1 Preset Vector network analyzer 2 Set internal source output power IF bandwidth scan points test frequency band and ot...

Page 73: ...ect the LOAD calibration element to the test port click the Load for Calibration After the calibration click Finish to exit the calibration interface complete the calibration and save the calibration...

Page 74: ...and Port 2 select the desired calibration kit in the Cal Kit select the type of calibration connector Female or Male in the DUT Connector Select Enhanced Response 1 2 or Enhanced Response Thru 2 1 in...

Page 75: ...ad items successively to complete the Port 1 calibration 6 According to the interface prompts connect the Open Short and Load calibration elements to Port2 successively and click the corresponding Ope...

Page 76: ...te the Port 2 calibration 7 Connect the THRU calibration kit between the two ports according to the interface prompts The parameters of the THRU do not have to be known Carry out unknown through Thru...

Page 77: ...g Thru Reflect and Line items to complete the Port 2 calibration 7 After the calibration click Finish to exit the calibration interface complete the calibration and save the calibration data 3 4 Inter...

Page 78: ...eset vector network analyzer 3 Set internal source output power IF bandwidth scan points test frequency band and other parameters 4 Select Cal Power Cal to enter the Settings screen 5 Select the test...

Page 79: ...ration of the receiver Figure 3 27 Receiver calibration setting interface Operating steps 1 Preset vector network analyzer 2 Set internal source output power IF bandwidth scan points test frequency ba...

Page 80: ...tioned previously which will introduce calibration errors After the S parameter calibration is performed the reference plane can be extended to the specified measurement plane by simply adding the add...

Page 81: ...ng to the system speed factor If unchecked the speed factor is set only for the specified port and when checked for all ports 5 Check the Port Extensions ON button and the Port extension will take eff...

Page 82: ...equency spans to choose Current Span The frequency span of the current interface setting Active Marker The frequency point currently marked In this case Loss2 can be ignored when setting loss only Los...

Page 83: ...vector network analyzer also provides several other functions for test fixtures 1 Port match 2 port embedding 2 Port impedance conversion 3 2 port de embedding 4 N port embed de embed port 4 6 8 5 Dif...

Page 84: ...te the setting and click Apply Fixtures to ON to take effect Figure 3 31 Port match Port impedance conversion operation steps 1 Ensure that the user has completed the S parameter calibration and obtai...

Page 85: ...set by the current interface if the Enable Extrapolation item is not checked the system will extrapolate the S2P file by default All the low frequency parameters not covered are replaced by the first...

Page 86: ...n 3 Select the topology type There are 3 topology types A using network 1 B using network 1 and 3 C using network 1 2 and 4 Select the port of the vector network analyzer in the VNA item select the Ne...

Page 87: ...rrent interface If you check the Enable Extrapolation tab the system will interpolate the frequency points not covered by S2P so that the frequency range of the S2P file is the same as that of the cur...

Page 88: ...S2P file making the frequency range of the S2P file the same as the frequency range of the current interface 4 Click Close to complete the setting and click Apply Fixtures to ON to take effect Figure...

Page 89: ...e Settings screen and select Remove in the Adapter tab 3 Remove the adaptor from the test cable Select Cal Adapter Removal Calibration to enter the Adapter Removal configuration screen Select the port...

Page 90: ...er Rotate is also known as the equal exchange adapter and equal length adapter calibration method Before the unknown pass through method was introduced the switching adapter method was often used as a...

Page 91: ...nized 2 Connect a port on the ECal module to the test port to be calibrated 3 Press Cal ECal on the front panel to enter the ECal menu interface Figure 3 38 ECal menu A ECal Config Select the number o...

Page 92: ...ull 2 Port calibration Full 3 Port calibration and Full 4 Port calibration B Select the Cal Type C When Orientation is Auto click Next to enter the automatic alignment directly When Orientation is Man...

Page 93: ...b Press Scale on the front panel Press Scale Scale Auto Scale c Determine if the differences between trace lines are acceptable 3 9 4 Orientation The ECal module automatically detects the connection b...

Page 94: ...panel press Cal Cal Characterization Factory to view all the parameters of the stored Characterization in the ECal module Figure 3 42 The factory information of Cal Kit A The date when the characteri...

Page 95: ...the Reference Marker will be created at the center of the trace Reference Markers are denoted by an R After creating a Reference Marker set the Reference Marker as value discretization fixed marker an...

Page 96: ...Fixed marker The fixed marker mode is closed by default Fixed markers have a fixed excitation position x axis coordinate its response value Y axis coordinate will change according to the trace data up...

Page 97: ...ration When the marker coupling mode is on the markers of the same number and X axis such as frequency or time on all traces in the coupling range share the settings and the marker s setting on the cu...

Page 98: ...t marker position and the reference marker position x coordinate Marker Ref Level Set the response value Y coordinate of the current marker to the reference level of the current trace Marker Delay Ref...

Page 99: ...in command select the search domain to be deleted in the pop up menu then click the Domain command again and then click Delete in the pop up menu If the search domain of the marker is deleted its sear...

Page 100: ...larity setting If the current peak polarity is set to Both the peak with the largest measured value among the effective positive peaks is searched Use the Peak Right Search command in the Peak submenu...

Page 101: ...the Multi Peak Target submenu Before searching for multiple peaks you need to set the threshold deviation and peak polarity in the Peak Threshold Peak Excursion and Peak Polarity commands in the subm...

Page 102: ...Enable again and select the Off option You can set whether to alarm when the bandwidth search fails in the Sound On Fail command Figure 4 2 Bandwidth search example 9 Notch search Press the Search but...

Page 103: ...the measured data by the data in the stored trace This function can be used to calculate the ratio of two traces such as calculating gain or attenuation which can also be regarded as the normalizatio...

Page 104: ...rface 2 Select the corresponding conversion type effective immediately 4 4 Equation editor In the equation editor we can input the algebraic formulas of standard mathematical operators and functions a...

Page 105: ...In the formula edit box enter functions operators and data to form the formula 3 After setting the formula click OK to exit the formula editing interface and click the Equation status to On to take ef...

Page 106: ...scalar a scalar b Returns a complex value a ib from two scalar values Exp complex a Returns the exponential of a Im complex a Returns the imaginary part of a as the scalar part of the result zeroes th...

Page 107: ...onversion 2 b 1 a 1 d b c H21 scalar i scalar j returns H21 Sii Sji Sij Sjj H22 complex a complex b complex c complex d H22 conversion 1 Z0 1 a 1 d b c 1 a 1 d b c H22 scalar i scalar j returns H22 Si...

Page 108: ...rns T22 Sii Sji Sij Sjj Y11 complex a complex b complex c complex d Y11 conversion 1 Z0 1 a 1 d b c 1 a 1 d b c Y11 scalar i scalar j Returns Y11 Sii Sji Sij Sjj Y12 complex a complex b complex c comp...

Page 109: ...mory data mem scalar i Memory data of trace i trace number xAxis X axis data xAxis scalar i X axis data of trace i trace number S11 S44 S parameter data Common H parameter Y parameter Z parameter F pa...

Page 110: ...t to Y parameter 11 1 0 1 11 1 22 12 21 1 11 1 22 12 21 12 1 0 2 12 1 11 1 22 12 21 21 1 0 2 21 1 11 1 22 12 21 22 1 0 1 11 1 22 12 21 1 11 1 22 12 21 3 S parameter convert to Z parameter 11 0 1 11 1...

Page 111: ...Description plus minus multiply divide power opening parenthesis closing parenthesis comma parameter separator equal E exponent Note operator priority 1 2 3 4 5 Trace statistics Click Math Analysis S...

Page 112: ...e display types Limit table setting Click Math Analysis Limit and the pop up dialog box is shown in the figure below Limit test sound type limit table global pass fail can be set in this interface Fig...

Page 113: ...measurements must pass Unless all measured data points are within the established test limits and the limit test is on the global pass fail status will be fail Note In this mode if there is a test tha...

Page 114: ...to the measured point value not to the interpolation Ripple table setting Click Math Analysis Limit Ripple to open the ripple test setting interface we can set ripple test sound type and ripple table...

Page 115: ...ine s starting point End stimulus Frequency of ripple limit line s ending point Max ripple Maximum value of ripple test Absolute The difference between the maximum and minimum in the frequency band Ma...

Page 116: ...ith chart or polar coordinate format the bandwidth test is skipped 4 9 Time domain A vector network analyzer is usually used to measure the frequency domain characteristics of the DUT For the time dom...

Page 117: ...cy will be automatically adjusted which will affect the calibration accuracy Therefore it is necessary to calibrate after setting the time domain measurement parameters Low pass step The simplest way...

Page 118: ...tion can only choose the required time domain response eliminate unnecessary time domain response and then view the frequency domain characteristic curve of the required response through Fourier trans...

Page 119: ...l Minimum 0 1 dB 25dB Normal 0 1 dB 45dB Wide 0 1 dB 52dB Maximum 0 01 dB 80dB 4 9 3 Window There will be sudden changes in the start and stop of frequency domain parameter measurement which will lead...

Page 120: ...nge the window size Kaiser Beta Use the value of Kaiser Beta to change the window size Impulse width Use the value of impulse width to change the window size Figure 4 15 Diagram of maximum and minimum...

Page 121: ...ling to open the coupling setting interface we can set transmission parameters and gating parameters in this interface Figure 4 16 Coupling setting interface Coupling on Click to enable coupling At th...

Page 122: ...yed Generally Auto can be selected when measuring S parameter and Reflection or Transmission can be selected when measuring any ratio parameter Auto If the measurement parameter is S parameter Reflect...

Page 123: ...network for high speed digital signal transmission by emphasis de emphasis or equalization the advanced waveform function in TDR waveform will be of vital use for you You don t need to change the DUT...

Page 124: ...again 5 3 TDR Setup Wizard The TDR setup wizard pops up when the TDR option is switched on for the first time Click the checkbox Show this wizard next start up to decide whether the wizard pops up whe...

Page 125: ...ology Under the topology Single Ended 1 Port you need to connect the cables and fixtures to the VNA connect the other ends of the fixtures to nothing or an OPEN calibration element Click the Measure b...

Page 126: ...is required to show the time domain responses of DUT in full The sweep frequency span and points of the channel are set according to the DUT length and the span of the transformation is automatically...

Page 127: ...e Power spinbox in the More Function bar of the Setup tab 5 5 7 Average The average function means that the final measure results are equal to the average of the measure results in the several sweeps...

Page 128: ...ttings click the Auto Scale button at the top of the TDR option and click the suitable option in the pull down menu Every option in the menu represents a set of automatic scale settings Option X means...

Page 129: ...T S parameters are functions of the signal frequency while T parameters are functions of the time under a specified stimulus type T parameters show the unit step impulse response of the DUT which is o...

Page 130: ...sidelobes which is called truncation effect Applying the Kaiser window lowers the sidelobe levels but aggravates the extension of the rise time or impulse width and brings down the resolution ratio o...

Page 131: ...nored while the option Bandpass means that the responses beyond the gating range will be ignored The scroll wheel and textbox can be used to change the start and stop position of the time domain gatin...

Page 132: ...earch at most as a start trace while it s allowed that more than one searches set the same trace as the stop trace The target relative level of the search can be set in the Position textbox in the dia...

Page 133: ...diagram This is different from the traditional way of using an oscilloscope to draw eye diagrams There is no need to provide an external digital signal to the input port of the DUT To simulate differ...

Page 134: ...ll possible binary numbers of n bits The initial condition of the LFSR is random PRBS generated becomes random to find the worst bit pattern of n bits for transmission performance Eye diagram simulati...

Page 135: ...o widen the eye by reducing the rise time properly But too small a rise time leads to ringing phenomena at the logic level of the output signal resulting in the decrease of the eye height To change th...

Page 136: ...elect or change the mask pattern applied click the Mask Pattern button in the Scale Mask bar to open the Mask Pattern dialog In the File tab of the dialog preinstalled standard patterns or user define...

Page 137: ...nual select the option Statistical in the Type pull down menu in the Stimulus box In the statistical mode the input bit pattern is set to PRBS with a fixed length so the statistical eye diagrams might...

Page 138: ...these parameters it s easy to simulate the influence of the different emphasis de emphasis strategies on the transmission performance in eye diagram simulations To change the parameters set the value...

Page 139: ...tive Channel delete the existing measurement or New Channel then click OK A Spectrum Analysis measurement is displayed in a new channel and New Window Figure 6 1 the interface of the Measurement Class...

Page 140: ...ox and select the receiver used for measurement Figure 6 3 the interface of the Measure dialog box 6 3 Spectrum Analyzer Settings 6 3 1 Basic Setup Press Freq on the front pane to enter the frequency...

Page 141: ...p frequencies are displayed at the bottom of the grid respectively The span and center frequency vary with the start frequency when the Span does not reach the minimum For more details please refer to...

Page 142: ...100 Hz and up to the maximum bandwidth Modifying the span in non zero span mode may cause an automatic change in both Freq Step and RBW if they are in Auto mode Besides the change of RBW may influenc...

Page 143: ...anel prss AvgBW SA to enter the menu interface of processing setup menu Figure 6 5 the interface of processing setup menu 6 3 2 1 RBW Set the RBW resolution bandwidth in order to distinguish between s...

Page 144: ...rm of a trace For each trace point the analyzer always captures all the data within a specific time interval and processes Peak Average etc the data using the detector currently selected then it displ...

Page 145: ...e average and detection average Power V 2 RBW Voltage LogPower Detect Avg Type VBW Trace Figure 6 6 Flow chart of Average type 1 Log Power Select the logarithmic decibel scale for all filtering and av...

Page 146: ...erface of BandPower 6 4 1 Band Power The total power of a specified frequency span Before turning on the Band Power function the marker point position and the frequency span should have be set The ver...

Page 147: ...ty Before turning on the Band Noise function the marker point position and the frequency span should have be set The vertical dashed lines on either side of the marker indicate the span The marked Y a...

Page 148: ...cording to the specified power ratio Before turning on the Occupied BW function the Occ BW Percent should have be set Vertical dashed lines on either side of the mark mark the span indicating the perc...

Page 149: ...e and recall The vector network analyzer supports save and recall functions for files of various formats Press the Save Recall button on the front panel and select file data calibration data and image...

Page 150: ...he Save SnP command to save the trace data in SnP format When saving the trace data in SnP format you can select the following formats LinMag Angle LogMag Angle and Real Imaginary in the SnP Format dr...

Page 151: ...e management interface 8 System setting Press the System button on the front panel We can set the IP address set the date restore the factory settings consult the help document set the buzzer self det...

Page 152: ...the pop up file browser and click OK to upgrade the firmware The firmware upgrade process may last for several minutes When the upgrade is completed the device will automatically restart Any operatio...

Page 153: ...vector network analyzer can be operated without operating the function keys on the front panel Figure 8 3 Hardkeys Preset Preset operation and related settings can be performed in Preset submenu Pres...

Page 154: ...tion Use the Power On Option command to set the default source of equipment reset when the equipment starts Power On Line Use the Power On Line command to set whether the device starts automatically w...

Page 155: ...he Buzzer command to turn the device sound on or off Complete Test Use the Complete Test command to test the completion tone Complete Buzzer Use the Complete Buzzer command to turn the completion tone...

Page 156: ...oard self test Key Test command touch screen self test Touch Test command screen self test Screen Test command and LED self test LED Test command System language The Language command in the Language s...

Page 157: ...g the options There are two ways for you 1 Pre activate the options by Siglent factory If you order a instrument and options Siglent factory will activate the options for you before delivery 2 Post ac...

Page 158: ...od SIGLENT will provide repair or replacement service according to the detailed provisions of the warranty For service or a complete copy of the warranty please contact your nearest SIGLENT sales and...

Page 159: ...onic loads and other general purpose test instrumentation Since its first oscilloscope was launched in 2005 SIGLENT has become the fastest growing manufacturer of digital oscilloscopes We firmly belie...

Reviews: