SNA5000A Vector Network Analyzer User Manual 42
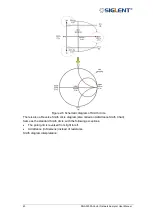
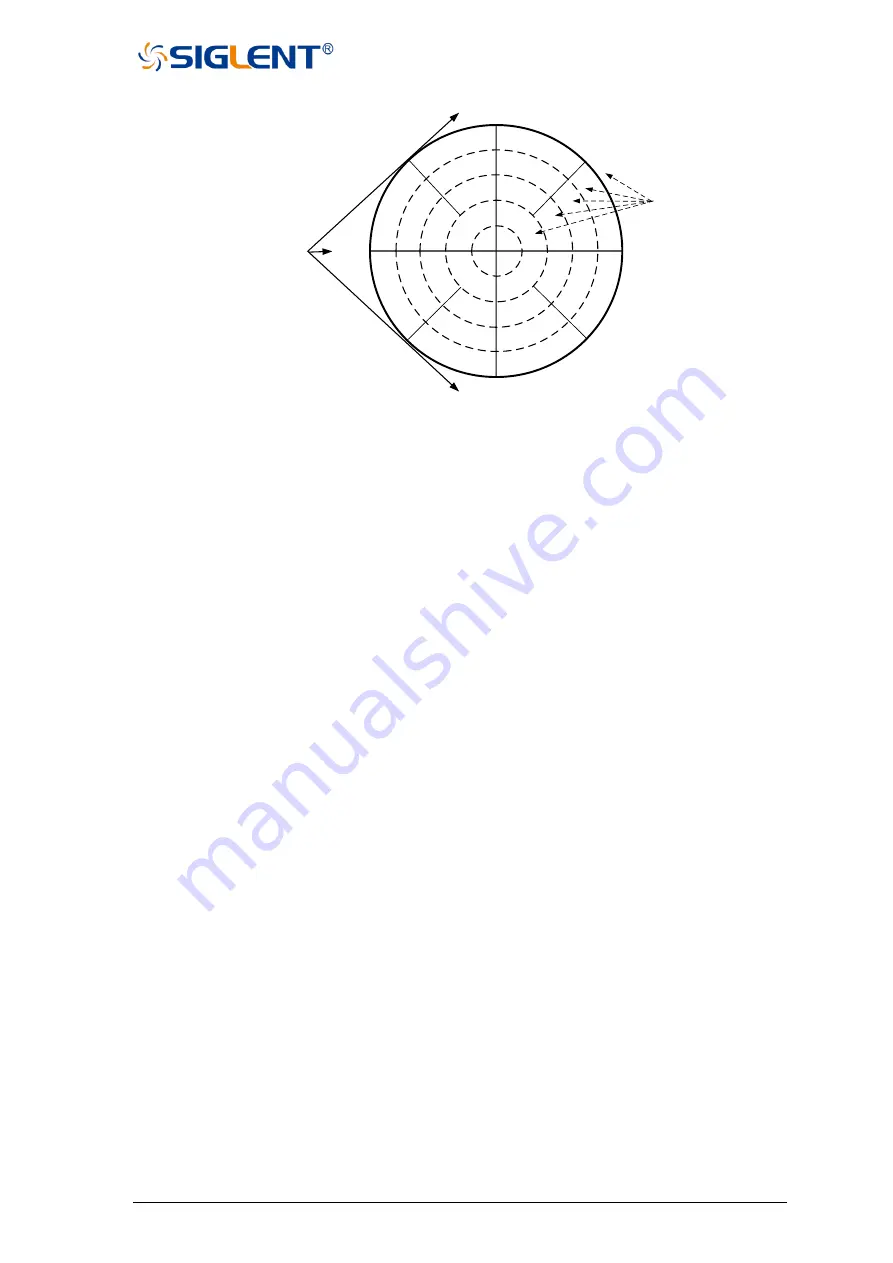
Figure 2-5 Polar diagram
•
The dotted circle indicates the reflection coefficient. The outermost circle represents the
reflection coefficient with a value of 1. The center of the circle represents the reflection
coefficient with a value of 0.
•
The radial line shows the phase angle of the reflected signal. The right-most position
corresponds to the zero-phase angle (that is, the reflected signal has the same phase as
the incident signal). The phase differences of 90°, ±180°, and -90° correspond to the top,
leftmost, and bottom of the polar display, respectively.
2.6.4
Smith circle diagram
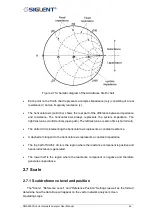
Smith diagrams are a tool for mapping complex reflectance coefficients to test the
impedance of equipment. In the Smith chart, the linear impedance plane is reshaped to form
a cyclic grid from which the resistance and reactance (R+ Jx) can be read.
You can use a cursor to display the following items:
•
Resistance (in Ohms)
•
Reactance as equivalent capacitance (in Ephraeras) or inductance (in Henrys)
0
Ω
±180°
∞Ω
0°
90°
-90°
0.2
0.4
0.6
0.8
1.0
The magnitude of
Γ
(
reflection coefficient
)
The phase Angle of the
reflected signal
Summary of Contents for SNA5000A Series
Page 2: ......


